Once a while, I have to work on Excel sheet manually. Today I have to search exported hundreds of ip addresses in a pre-defined excel spreadsheet to see if there is a match. It seems a easy work, but it took me almost an hour to find right formula.
Column O includes all exported ip addresses. I have to manually search if those column O's ip addresses are appearing in column B's text. If yes, which row is it?
Formula is set at Column N.
=MATCH("*"&(O6)&"*",B:B,0)
As you can see from cell N6, the number is 7, which means the text in B7 includes O6's string.
N12's number is 5, which means the test in B5 includes O12's string.
Blog focusing on networking security products from Cisco, Check Point, Juniper, F5, Fortinet, VMware and GNS3.
Thursday, February 26, 2015
Wednesday, February 25, 2015
Using PRTG SNMPv3 Monitoring Juniper SRX 240H Alarm andTemperature
One of our SRX240H is having temperature problem. Whenever the temperature reached 50 Celsius degree, system alarm will be on. Alarm email should be sent out when temperature reached threshold 50. SRX itself seems not able to send alarm email out based on this discussion. NSM or other SNMP tools may help in this situation.
PRTG is using to monitor our network devices and it works great with SNMPv3. My previous post has described how to monitor SRX's CPU, Memory, Flow Sessions etc. Alarm status and Temperature is another sensor I am looking for to monitor. There are couple of ways to do it. You can use NSM to send alarm email, firewall itself to send snmp traps to your SNMP server, or Network Monitoring Tools to pull SNMP OID values then send email. In my case, PRTG is preferred way to monitor system status and send alarming email based on the requirement.
Note: A generic local engine-id must be configured. Otherwise (e.g. when the MAC is used) SNMPv3 will not work in cluster configurations. After configuring the engine-id, committing the configuration might be required because the engine-id is involved in the key generation below.
To make NSM work with SRX, location and contact should not be set. Else, after the configuration imported into NSM, when you push policy from NSM to SRX, snmpv3 anthentication password and privacy password will be changed.
In my working configuration for NSM and SRX 240H / 1400 Cluster, the configuration looks like below:
PRTG can be easily integrated into your network monitoring system and execute comprehensive monitoring tasks. Also , alerting feature is quite flexible to meet your organization needs. Even one normal windows server can monitoring thousands of sensors without problem.
For SNMPv3 configuration in the PRTG, right click edit pop up menu at root properties of Device tab, enter the snmpv3 information:
Then you can add your network devices with inherited configuration. All new device will get same snmpv3 configuration.
we are able to find out a couple of values for temperature:
From the database search result, it shows jnxOperatingTemp = 1.3.6.1.4.1.2636.3.1.13.1.7
In this case, jnxOperatingTemp.9.2.0.0 is 1.3.6.1.4.1.2636.3.1.13.1.7.9.2.0.0. That is exactly OID we need for this monitoring.
Step 1: SNMPv3 on SRX
set snmp v3 usm local-engine user SRXAES authentication-md5 authentication-password Test1234
set snmp v3 usm local-engine user SRXAES privacy-aes128 privacy-password Test12345
set snmp engine-id local 4716
set snmp view view_all oid 1 include
set snmp filter-duplicates
set snmp health-monitor
set snmp location "<location>"
set snmp contact "<contact name>"
set snmp community <community-name> authorization read-only
set snmp community <community-name> clients <snmp-host>
set snmp community <community-name> clients 0.0.0.0/0 restrict
Note: A generic local engine-id must be configured. Otherwise (e.g. when the MAC is used) SNMPv3 will not work in cluster configurations. After configuring the engine-id, committing the configuration might be required because the engine-id is involved in the key generation below.
To make NSM work with SRX, location and contact should not be set. Else, after the configuration imported into NSM, when you push policy from NSM to SRX, snmpv3 anthentication password and privacy password will be changed.
In my working configuration for NSM and SRX 240H / 1400 Cluster, the configuration looks like below:
root@fw-srx-1> show configuration snmp
v3 {
usm {
local-engine {
user SRXAES {
authentication-md5 {
authentication-key "$9$cOJSKMWLxNbs8LUjq.zF9ApuIEM8Xx-VvM4aJGq.Tz390BhSrlM836evW8dVP5TCuO1EhrOB-VYgJZ69CApBlKM-bsKv4aZUHkBIRcevdbsY4aSr8boa/CAtu1SyKW87vMX-bs4oJGDk5Q9ApREyk.hSreXxk5Qn/9pOBE3nA0O1hcYg4oDi"; ## SECRET-DATA
}
privacy-aes128 {
privacy-key "$9$4yaZjq.53/CmPF/CtIRNdVsoJDik.mTZGp01IcSM8XNds4oGDHqvWUjqmTQevM8dbYgojk.4oz369OBX7N-s2JZjPfz.muOBIrlLxNdVYgoDkY2QF6/tpM8Lx7VY2aGjHaJUH.PQzEcSl8XVwYaGDsYoGiH5T369pIErev7dbuONdbYoan/9AtO"; ## SECRET-DATA
}
}
}
}
vacm {
security-to-group {
security-model usm {
security-name SRXAES {
group readonly;
}
}
}
access {
group readonly {
default-context-prefix {
security-model usm {
security-level privacy {
read-view view_all;
}
}
}
}
}
}
}
engine-id {
local 109849;
}
view view_all {
oid 1 include;
}
client-list snmpclient {
10.1.1.11/31;
0.0.0.0/0 {
restrict;
}
}
Step 2: PRTG Configuration
PRTG can be easily integrated into your network monitoring system and execute comprehensive monitoring tasks. Also , alerting feature is quite flexible to meet your organization needs. Even one normal windows server can monitoring thousands of sensors without problem.
For SNMPv3 configuration in the PRTG, right click edit pop up menu at root properties of Device tab, enter the snmpv3 information:
Then you can add your network devices with inherited configuration. All new device will get same snmpv3 configuration.
Step 3: Add SNMP Custom Sensor
Following instruction on the screen to add sensor for your network devices, you will need to pick SNMP category's SNMP Custom type sensor.In the basic sensor settings, the most important thing is OID values. You will need to know exact OID number to make your own monitoring sensor in the PRTG.
Lets go back to our SRX firewall to find out what the temperature SNMP mib oid is:
Show snmp mib walk 1.3.6.1.4.1 | match temp
we are able to find out a couple of values for temperature:
jnxOperatingTemp.9.1.0.0 = 50From Show Chassis Routing-Engine, there are different type of temperature for cpu and chassis , also for different node if it is cluster configuration.
jnxOperatingTemp.9.2.0.0 = 49
jnxFruTemp.9.1.0.0 = 50
jnxFruTemp.9.1.1.0 = 50
jnxFruTemp.9.2.0.0 = 48
jnxFruTemp.9.2.1.0 = 48
root@fw-srx-1> show chassis routing-engineNext step is to find out OID from online website OID database , such as http://oid-info.com/ or Solarwinds SNMP Center:
node0:
--------------------------------------------------------------------------
Routing Engine status:
Temperature 50 degrees C / 122 degrees F
CPU temperature 49 degrees C / 120 degrees F
Total memory 1024 MB Max 850 MB used ( 83 percent)
Control plane memory 560 MB Max 493 MB used ( 88 percent)
Data plane memory 464 MB Max 362 MB used ( 78 percent)
CPU utilization:
User 7 percent
Background 0 percent
Kernel 5 percent
Interrupt 0 percent
Idle 87 percent
Model RE-SRX240H
Serial ID AAEP4868
Start time 2015-01-18 13:24:42 UTC
Uptime 38 days, 8 hours, 29 minutes, 47 seconds
Last reboot reason 0x200:normal shutdown
Load averages: 1 minute 5 minute 15 minute
0.16 0.44 0.46
node1:
--------------------------------------------------------------------------
Routing Engine status:
Temperature 48 degrees C / 118 degrees F
CPU temperature 50 degrees C / 122 degrees F
Total memory 1024 MB Max 696 MB used ( 68 percent)
Control plane memory 560 MB Max 336 MB used ( 60 percent)
Data plane memory 464 MB Max 357 MB used ( 77 percent)
CPU utilization:
User 5 percent
Background 0 percent
Kernel 3 percent
Interrupt 0 percent
Idle 92 percent
Model RE-SRX240H
Serial ID AAEK3334
Start time 2015-02-15 16:05:14 UTC
Uptime 10 days, 5 hours, 49 minutes, 24 seconds
Last reboot reason 0x200:normal shutdown
Load averages: 1 minute 5 minute 15 minute
0.06 0.08 0.08
From the database search result, it shows jnxOperatingTemp = 1.3.6.1.4.1.2636.3.1.13.1.7
In this case, jnxOperatingTemp.9.2.0.0 is 1.3.6.1.4.1.2636.3.1.13.1.7.9.2.0.0. That is exactly OID we need for this monitoring.
Step 4. Create email alarm
After checked the thresholds for temperature as shown in below, we will build an alarm email.root@fw-srx-1> show chassis temperature-thresholdsBased on this Object Triggers set up, once the JnxOperatingTemp sensor's value is above 51 for 60 seconds, an email will be sent out to admin.
node0:
--------------------------------------------------------------------------
Fan speed Yellow alarm Red alarm Fire Shutdown
(degrees C) (degrees C) (degrees C) (degrees C)
Item Normal High Normal Bad fan Normal Bad fan Normal
Chassis default 35 45 50 40 75 65 100
Routing Engine 35 45 50 40 75 65 100
node1:
--------------------------------------------------------------------------
Fan speed Yellow alarm Red alarm Fire Shutdown
(degrees C) (degrees C) (degrees C) (degrees C)
Item Normal High Normal Bad fan Normal Bad fan Normal
Chassis default 35 45 50 40 75 65 100
Routing Engine 35 45 50 40 75 65 100
Reference:
- Junos temperature thresholds in SRX devices and the actions taken when it exceeds the threshold
- Monitoring Juniper SRX Firewall CPU, Memory and Flow Session Information from PRTG
- How can I use a trusted SSL certificate with the PRTG web interface?
Monday, February 23, 2015
A Quick Test to Check Point Capsule Cloud Service
Not sure how many Checkpoint customers are using this service, but it is quite attractive when I heard about it. It will help your remote users connect with your global offices and Internet seamlessly.
Roaming users will use a vpn tunnel to connect to Check Point's cloud network, from there they could access their company's Internal network with another pre-built vpn tunnel. Also from Check Point Cloud, roaming users will be able to browse Internet safely with Check Point's cloud service:
- URL Filtering
- Anti-Virus
- Anti-Bot
- Threat Emulation
- IPS
- HTTPS Inspection
Lets start to experience it:
Step 1: Register an account at https://cloud.checkpoint.com/ with your email account
After registration, you will receive a email with subject "Your Capsule Connect registration code". Inside the email, there are all links to download the client for Windows, Macintosh, Android and iOS versions.Step 2: Download and Install the Client:
From "Your Capsule Connect registration code" email, download windows client on your pc. Double click and follow on screen instruction to complete software installation. You will find a cloud icon appears on your right bottom screen. Basically the client will install a new Local Area Connection network driver "Check Point Virtual Network Adapter For Cloud Connect" in your system.
Right click the cloud icon:
Select 'Show Client' menu to enable main window. Choose connect button to make a connection to Check Point's Cloud network.
After system connected to the cloud, you will find your system got a new ip address (172.16.9.28/22) from DHCP server 172.16.9.27 with DNS server 8.8.8.8.
Also from Speedtest.net, we will see the system got an US ip address 208.43.242.98. The download and upload speed is not that bad.
My pc is having almost 100Mbps download / upload speed without connecting to Checkpoint Cloud.
Step 3: Log into https://cloud.checkpoint.com/ to review the configuration and policies
Check Point Capsule Cloud Policy Tab.Under Security Policy, there are three features enabled:
- URL Filtering
- Threat Prevention
- HTTPS Inspection
Step 4: Troubleshooting for https website issue
By default, there is a problem to browse https website, such as Gmail site.It shows a This Connection is Untrusted and the connection is blocked.
From the "Logs & Reports" tab, it shows Check Point Cloud Service Application Cloud blade blocked those
Double click the log entry you will get the log details for that record.
After turned off HTTPS Inspection from Policy tab, those https website become available again.
Reference:
Wednesday, February 18, 2015
Error :%CERM-4-TX_BW_LIMIT: Maximum Tx Bandwidth limit of 85000 Kbps reached for Crypto functionality with securityk9 technology package license
This error message is coming in the one of our router's log constantly.
It is caused by our Security k9 license limitation. Basically if you do not have a HSEC-k9 license installed on your ISR G2 router, you will see this error message on the console if the traffic exceeds 85-Mbps unidirectional or 170-Mbps bidirectional.
By upgrading to hseck9 license should be able to remove this error messages. Cisco document Cisco ISR G2 SEC and HSEC Licensing explains well what the difference is between them.
"The HSEC-K9 license removes the curtailment enforced by the U.S. government export restrictions on the encrypted tunnel count and encrypted throughput. HSEC-K9 is available only on the Cisco 2921, Cisco 2951, Cisco 3925, Cisco 3945, Cisco 3925E, and Cisco 3945E. With the HSEC-K9 license, the ISR G2 router can go over the curtailment limit of 225 tunnels maximum for IP Security (IPsec) and encrypted throughput of 85 -Mbps unidirectional traffic in or out of the ISR G2 router, with a bidirectional total of 170 Mbps. "
From our Monitoring software PRTG living traffic, it shows between 8:45AM and 9:00AM, there are obviously traffic spike which reached almost 40mbps. The data was collected and averaged by per minute from PRTG software. It seems the traffic might reach 85mbps at a couple of seconds and triggered this error message on the router logs.
To avoid traffic be throttled by this license limitation, following steps will be able to help you:
But you should be able to get following message from the log:
081062: Feb 18 09:24:08.621 EST: %CERM-4-TX_BW_LIMIT: Maximum Tx Bandwidth limit of 85000 Kbps reached for Crypto functionality with securityk9 technology package license.
It is caused by our Security k9 license limitation. Basically if you do not have a HSEC-k9 license installed on your ISR G2 router, you will see this error message on the console if the traffic exceeds 85-Mbps unidirectional or 170-Mbps bidirectional.
By upgrading to hseck9 license should be able to remove this error messages. Cisco document Cisco ISR G2 SEC and HSEC Licensing explains well what the difference is between them.
"The HSEC-K9 license removes the curtailment enforced by the U.S. government export restrictions on the encrypted tunnel count and encrypted throughput. HSEC-K9 is available only on the Cisco 2921, Cisco 2951, Cisco 3925, Cisco 3945, Cisco 3925E, and Cisco 3945E. With the HSEC-K9 license, the ISR G2 router can go over the curtailment limit of 225 tunnels maximum for IP Security (IPsec) and encrypted throughput of 85 -Mbps unidirectional traffic in or out of the ISR G2 router, with a bidirectional total of 170 Mbps. "
From our Monitoring software PRTG living traffic, it shows between 8:45AM and 9:00AM, there are obviously traffic spike which reached almost 40mbps. The data was collected and averaged by per minute from PRTG software. It seems the traffic might reach 85mbps at a couple of seconds and triggered this error message on the router logs.
To avoid traffic be throttled by this license limitation, following steps will be able to help you:
1. Get PAK number from your vendor who handles purchasing for you.
a. Quotation:
It will cost your company about $674 to remove this limitation on your routerb. Get Product Authorization Key (PAK):
After you order the license, your vendor will e-delivery to your email with this kind of pdf file:2. Register License at Cisco license Website
http://tools.cisco.com/SWIFT/LicensingUI/Quickstart3. Install the license:
Router#copy ftp://test:test@10.94.1.1 flash:
Address or name of remote host [10.94.1.1]?
Source filename [2.lic]? 2.lic
Destination filename [2.lic]? 2.lic
Accessing ftp://*****:*****@10.94.1.1/2.lic...
Loading 2.lic !
[OK - 1153/4096 bytes]
1153 bytes copied in 0.440 secs (2620 bytes/sec)
Router#license install flash:2.lic
Installing licenses from "flash:2.lic"
Installing...Feature:hseck9...Successful:Supported
1/1 licenses were successfully installed
0/1 licenses were existing licenses
0/1 licenses were failed to install
4. Verify
There is no way to find out hseck9 license has been applied from show version and show license since security k9 license already applied.But you should be able to get following message from the log:
081111: Feb 18 10:42:19.017 EST: %LICENSE-6-INSTALL: Feature hseck9 1.0 was installed in this device. UDI=C3900-SPE100/K9:FOC17027ZDD; StoreIndex=2:Primary License Storage
Reference:
1. Cisco ISR G2 SEC and HSEC LicensingThursday, February 12, 2015
Basic Cisco Tacacs+ Configuration With Free Tacacs+ Software for Windows - Part 2
Part 1 has shown how to install the software Tacacs+ on a windows 2008 server and some fastest configuration to get it working with your Windows server administrators group.
In this part 2 post, more configuration will be presented to explain how some other function or feature works.
After installation, four configuration files will be generated under C:\ProgramData\TACACS.net\config folder. Please keep in mind, different OS will have different location to hold those files. Please create a backup copy in case you want to recover them.
This is the second part to configure cisco switch to work with a Free Tacacs+ Software from http://tacacs.net:
There are two users , user1 and user2 , pre-configured to be used. For example, the user1 's login password is somepassword, and no password for enable.
Basically find out following configuration in the authentication.xml, Local System Administrators groups have been permitted. Only thing you will need to do is to add new users into local administrators group in windows 2008 Tacacs server as shown in part 1. There is no need to set up Enable Password, since your localhost user's password will be enable password too.
By adding <Permit>enable</Permit> into following configuration, you will be able to use enable command. Keep in mind, the enable password is same as your login password when you use Local Server's administrators group or AD users.
In this part 2 post, more configuration will be presented to explain how some other function or feature works.
After installation, four configuration files will be generated under C:\ProgramData\TACACS.net\config folder. Please keep in mind, different OS will have different location to hold those files. Please create a backup copy in case you want to recover them.
- authentication.xml
- authorization.xml
- clients.xml (Your Network Devices Clients)
- tacplus.xml (The global configuration for TACACS.net such as IP, Port, Logging and Syslog)
1. authentication.xml
1.1 Local Service (File Group) Users
Tacacs+ Software supports different authentication methods such as Local Service (File Group) Users, Localhost Users and AD users.This is the second part to configure cisco switch to work with a Free Tacacs+ Software from http://tacacs.net:
- Basic Cisco Tacacs+ Configuration With Free Tacacs+ Software for Windows - Part 1
- Basic Cisco Tacacs+ Configuration With Free Tacacs+ Software for Windows - Part 2
There are two users , user1 and user2 , pre-configured to be used. For example, the user1 's login password is somepassword, and no password for enable.
<!-- FILE GROUP EXAMPLE -->
<!-- This is an example of a File User group.
The File User groups can be used to define users that only exist
within the TACACS+ server. -->
<UserGroup>
<Name>Local Tacacs Server Group</Name>
<AuthenticationType>File</AuthenticationType>
<Users>
<User>
<Name>user1</Name>
<LoginPassword ClearText="somepassword" DES=""> </LoginPassword>
<EnablePassword ClearText="" DES=""></EnablePassword>
<CHAPPassword ClearText="" DES=""> </CHAPPassword>
<OutboundPassword ClearText="" DES=""> </OutboundPassword>
</User>
<User>
<Name>user2</Name>
<LoginPassword ClearText="somepassword" DES=""> </LoginPassword>
<EnablePassword ClearText="" DES=""></EnablePassword>
<CHAPPassword ClearText="" DES=""> </CHAPPassword>
<OutboundPassword ClearText="" DES=""> </OutboundPassword>
</User>
</Users>
</UserGroup>
1.2 Localhost Users
Localhost users is the local users and groups in the windows 2008 server itself. In the part 1, there are some steps already shows how to use Localhost users.Basically find out following configuration in the authentication.xml, Local System Administrators groups have been permitted. Only thing you will need to do is to add new users into local administrators group in windows 2008 Tacacs server as shown in part 1. There is no need to set up Enable Password, since your localhost user's password will be enable password too.
<!-- LOCALHOST EXAMPLE -->
<!-- This is an example of a Windows Localhost group.
This group will authenticate using the users and groups
configured on the local computer. -->
<UserGroup>
<Name>Local System Administrators</Name>
<AuthenticationType>Localhost</AuthenticationType>
<LocalhostGroupName>Administrators</LocalhostGroupName>
</UserGroup>
<!-- / LOCALHOST EXAMPLE -->
1.3 AD authentication
AD authentication and LDAP authentication has been detailed documented in the configuration guide. Please check it from there.2. authorization.xml
By default, if you log in your network devices with Tacacs+ software default configuration with your local file users or local server's administrators group account, you will not be able to get into enable mode. Following error will be shown to you after you type enable command:The command 'enable <cr>' is not authorized for user user1That is because the authorization.xml did not authorize you to use enable command.
By adding <Permit>enable</Permit> into following configuration, you will be able to use enable command. Keep in mind, the enable password is same as your login password when you use Local Server's administrators group or AD users.
<Authorization>
<UserGroups>
<UserGroup>Local System Administrators</UserGroup>
</UserGroups>
<!--No client group provided so this authorization section applies to the above user groups from all the clients -->
<!--this group is allowed to telnet everywhere except from addresses beginning with 161.-->
<Shell>
<!--<deny>telnet 161\.*</deny>
<Permit>telnet .*</Permit>-->
<Permit>enable</Permit> <!--this will allow this group to run enable command -->
<Permit>.*show.*</Permit> <!--This will allow all show commands -->
<Deny>.*</Deny> <!--This will deny all other commands -->
</Shell>
</Authorization>
3. Client Configuration
Until here, a functional Tacacs+ server will be fully up and running. You should be able to use local file users and local administrators group to log into your network device. The client (network devices) configuration for Tacacs+, you should be able to find it from Part 1. Following commands should get you basic ideas how the configuration looks like.Router(config)# aaa new-model
Router(config)# tacacs-server host 10.94.200.14 key mysharedsecret
Router(config)# aaa authentication login default group tacacs+ local
Router(config)# aaa authorization exec default group tacacs+ local
Router(config)# line console 0
Router(config-line)# login authentication default
Router(config)# line vty 0 15
Router(config-line)# login authentication default
Notes:
There are a couple of useful tools installed as well , and those are for troubleshooting / testing purpose. You could find it from Start -> All Programs -> TACTACS.net menu:- TACDES - Used to Encrypt your password in your configuration files
- TACTest - Used for testing your authentication
- TACVerify - USed to verify your configuration files. Each time, after you changed your configuration files, do not forget to run it to validate them. If there is anything wrong in those files, your TACACS.net service won't be able to start.
Reference:
Sunday, February 8, 2015
Basic Cisco Tacacs+ Configuration With Free Tacacs+ Software for Windows - Part 1
Both RADIUS and TACACS+ provides centralized validation of users attempting to gain access to a both protocols supported network devices, which provides Authentication, Authorization, and Accounting (AAA) services on network devices.
RADIUS stands for Remote Access Dial-In User Service, and TACACS+ stands for Terminal Access Controller Access Control Service Plus. The primary functional difference between RADIUS and TACACS+ is that TACACS+ separates out the Authorization functionality, where RADIUS combines both Authentication and Authorization. RADIUS was designed for subscriber AAA, and TACACS+ is designed for administrator AAA. RADIUS can still be used for small network administrator AAA, but only if authorization is not required, or if it is a homogeneous network (all one vendor). In any scenario where there is a heterogeneous environment or authorization policies are required for network devices, TACACS+ is the best option.
The following figure and table show their difference more instinctively:
This post and next one will show the basic Tacacs+ configuration steps on a cisco 2960 switch to work with Free Tacacs+ Software for Windows from tacacs.net:
After installation, TACACS.net service will automatically start. Localhost (127.0.0.1) and RFC 1918 IP address ranges (172.16.0.0/12, 192.168.0.0/16, 10.0.0.0/8) are already added as clients by default. Any user in the Administrators group on the local machine will be authorized as the fallback method.
Check tacplus.xml to make sure server ip is not 127.0.0.1.
You do not need to restart/reload the server when you modify the configuration files. The server
monitors for changes to the configuration files and reloads them automatically.
Reference:
RADIUS stands for Remote Access Dial-In User Service, and TACACS+ stands for Terminal Access Controller Access Control Service Plus. The primary functional difference between RADIUS and TACACS+ is that TACACS+ separates out the Authorization functionality, where RADIUS combines both Authentication and Authorization. RADIUS was designed for subscriber AAA, and TACACS+ is designed for administrator AAA. RADIUS can still be used for small network administrator AAA, but only if authorization is not required, or if it is a homogeneous network (all one vendor). In any scenario where there is a heterogeneous environment or authorization policies are required for network devices, TACACS+ is the best option.
The following figure and table show their difference more instinctively:
This post and next one will show the basic Tacacs+ configuration steps on a cisco 2960 switch to work with Free Tacacs+ Software for Windows from tacacs.net:
- Basic Cisco Tacacs+ Configuration With Free Tacacs+ Software for Windows - Part 1
- Basic Cisco Tacacs+ Configuration With Free Tacacs+ Software for Windows - Part 2
1. Software Installation and Verify Configuration
1.1 Download Software
Please download Version 1.3.2, which is from their website http://www.tacacs.net/1.2 Installation
Double click downloaded file TACACSSetup_v1.3.2.zip and simply click next to follow the wizard to complete the installation.
1.3 Configuration Tacacs+ server
The wizard will install the configuration and log files to different locations depending on your OS. Start Menu TACACS.net program group has a configuration shortcut to point to the configuration folder. In my case, all configuration files was installed at this directory: C:\ProgramData\TACACS.net\configCheck tacplus.xml to make sure server ip is not 127.0.0.1.
You do not need to restart/reload the server when you modify the configuration files. The server
monitors for changes to the configuration files and reloads them automatically.
1.4 Verify Tacacs service
telnet 127.0.0.1 49(test1 is the local administrator account in my Tacacs windows server)
tactest -s 10.94.200.14 -u test1 -p test1
2. Configure Cisco Switch to Use Tacacs server
Router(config)# aaa new-modelBased on above configuration steps 1 and step 2, the switch will be authenticated with Tacacs server's account in the local administrators group.
Router(config)# tacacs-server host 10.94.200.14 key mysharedsecret
Router(config)# aaa authentication login default group tacacs+ local
Router(config)# aaa authorization exec default group tacacs+ local
Router(config)# line console 0
Router(config-line)# login authentication default
Router(config)# line vty 0 15
Router(config-line)# login authentication default
Notes:
Fallback group includes all local administrators on the server. It should be commented out before it is deployed in production.Reference:
Friday, February 6, 2015
Flexible Netflow (FnF) Configuration for PRTG
If you are still not knowing FnF (Flexible Netflow) technology, probably your Netflow knowledge did not get updated for last a couple of years. Basically Flexible Netflow allows user to decide which information you want to export through Netflow. It is extension of Netflow v9. For more information, I would suggest to read some of reference websites first at the end of this post. This post will only focus on the configuration in the real environment with Cisco 4510 and how it will be used in PRTG - this powerful and & easy network monitoring tool.
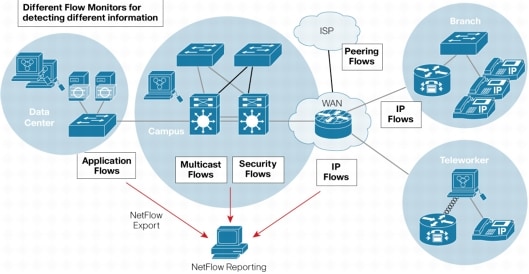
As shown in the following diagrams, different flows will be defined for detecting different information and used for different purpose.
Flexible NetFlow can track a wide range of packet information for Layer2, IPv4, IPv6 Flows.
• Source and destination Mac Addresses
• Source and destination IPv4 or IPv6 addresses
• Source and destination TCP/User Datagram Protocol (UDP) ports
• Type of service (ToS)
• DSCP
• Packet and byte counts
• Flow timestamps
• Input and output interface numbers
• TCP flags and encapsulated protocol (TCP/UDP) and individual TCP Flags
• Sections of packet for deep packet inspection
• All fields in IPv4 Header including IP-ID, TTL and others
• All fields in IPv6 Header including Flow Label, Option Header and others
• Routing information (next-hop address, source autonomous system (AS) number, destination AS number, source prefix mask, destination prefix mask, BGP Next Hop, BGP Policy Accounting traffic index)
In my environment, I am having Cisco-4510R+E with Supervisor 8-E, using ipbase cat4500es8-universalk9.SPA.03.03.01.XO.151-1.XO1.bin IOS file. There is no Netflow service card installed. But flexible netflow is supported
Add a new Sensor at this Switch Device and put Vlan 1 ip address into Sendor IP. Receive NetFlow Packets on UDP port is 9995.
2. Interface Flow monitor output does not support on Cisco 4500 switch yet.
This feature is only available if the NetFlow Services Card (WS-F4531) is present. The modules can be viewed by executing the “show module” command.
For example:
The basic command set is as follows:
2. Cisco IOS Flexible NetFlow Technology Q&A
3. What is Flexible NetFlow part 1 of 3
As shown in the following diagrams, different flows will be defined for detecting different information and used for different purpose.
Flexible NetFlow can track a wide range of packet information for Layer2, IPv4, IPv6 Flows.
• Source and destination Mac Addresses
• Source and destination IPv4 or IPv6 addresses
• Source and destination TCP/User Datagram Protocol (UDP) ports
• Type of service (ToS)
• DSCP
• Packet and byte counts
• Flow timestamps
• Input and output interface numbers
• TCP flags and encapsulated protocol (TCP/UDP) and individual TCP Flags
• Sections of packet for deep packet inspection
• All fields in IPv4 Header including IP-ID, TTL and others
• All fields in IPv6 Header including Flow Label, Option Header and others
• Routing information (next-hop address, source autonomous system (AS) number, destination AS number, source prefix mask, destination prefix mask, BGP Next Hop, BGP Policy Accounting traffic index)
In my environment, I am having Cisco-4510R+E with Supervisor 8-E, using ipbase cat4500es8-universalk9.SPA.03.03.01.XO.151-1.XO1.bin IOS file. There is no Netflow service card installed. But flexible netflow is supported
CS#show module
Chassis Type : WS-C4510R+E
Power consumed by backplane : 40 Watts
Mod Ports Card Type Model Serial No.
---+-----+--------------------------------------+------------------+-----------
1 48 10/100/1000BaseT EEE (RJ45) WS-X4748-RJ45-E CA1737L5CP
2 48 10/100/1000BaseT Premium POE E Series WS-X4748-RJ45V+E CA1746L5KJ
3 48 10/100/1000BaseT Premium POE E Series WS-X4748-RJ45V+E CA1746L5RN
4 48 10/100/1000BaseT (RJ45) WS-X4648-RJ45-E JA17410F8D
5 8 Sup 8-E 10GE (SFP+), 1000BaseX (SFP) WS-X45-SUP8-E CA1749L63E
7 48 10/100/1000BaseT (RJ45) WS-X4648-RJ45-E JA17410AF6
8 12 10GE SFP+ WS-X4712-SFP+E CA1741L4FU
9 48 10/100/1000BaseT (RJ45) WS-X4648-RJ45-E JA17410F1K
10 48 10/100/1000BaseT EEE (RJ45) WS-X4748-RJ45-E CA1806L2H6
M MAC addresses Hw Fw Sw Status
--+--------------------------------+---+------------+----------------+---------
1 885a.924.69c0 to 885a.9244.69ef 1.1 Ok
2 24e9.b34.9748 to 24e9.b3f4.9777 1.3 Ok
3 24e9.bf4.9988 to 24e9.b3f4.99b7 1.3 Ok
4 e4c7.2df.d9da to e4c7.22df.da09 2.1 Ok
5 24e9.3fb.a4c0 to 24e9.b3fb.a4c7 1.0 15.1(1r)SG1 03.03.01.XO Ok
7 e4c7.2df.b42a to e4c7.22df.b459 2.1 Ok
8 78da.e56.3ad0 to 78da.6e56.3adb 2.0 Ok
9 e4c7.2df.d01a to e4c7.22df.d049 2.1 Ok
10 7426.c47.9dcc to 7426.ac47.9dfb 1.2 Ok
Mod Redundancy role Operating mode Redundancy status
----+-------------------+-------------------+----------------------------------
5 Active Supervisor SSO Active
CS#sh verCisco IOS Software, IOS-XE Software, Catalyst 4500 L3 Switch Software (cat4500es8-UNIVERSALK9-M), Version 03.03.01.XO RELEASE SOFTWARE (fc1)Technical Support: http://www.cisco.com/techsupportCopyright (c) 1986-2014 by Cisco Systems, Inc.Compiled Wed 30-Apr-14 02:55 by prod_rel_teamThis simple sample will configure traditional NetFlow export using the new Flexible NetFlow CLI. The user will create the Flow Monitor and attaches the Flow Record and Flow Exporter to the Flow Monitor.
Cisco IOS-XE software, Copyright (c) 2005-2013 by cisco Systems, Inc.All rights reserved. Certain components of Cisco IOS-XE software arelicensed under the GNU General Public License ("GPL") Version 2.0. Thesoftware code licensed under GPL Version 2.0 is free software that comeswith ABSOLUTELY NO WARRANTY. You can redistribute and/or modify suchGPL code under the terms of GPL Version 2.0. For more details, see thedocumentation or "License Notice" file accompanying the IOS-XE software,or the applicable URL provided on the flyer accompanying the IOS-XEsoftware.
ROM: 15.1(1r)SG1CS uptime is 30 weeks, 4 days, 10 hours, 5 minutesUptime for this control processor is 30 weeks, 4 days, 10 hours, 6 minutesSystem returned to ROM by reloadSystem restarted at 16:18:25 UTC Mon Jul 7 2014System image file is "bootflash:/cat4500es8-universalk9.SPA.03.03.01.XO.151-1.XO1.bin"Jawa Revision 3, RadTrooper Revision 0x0.0x41, Conan Revision 0x1449
Last reload reason: Reload command
This product contains cryptographic features and is subject to UnitedStates and local country laws governing import, export, transfer anduse. Delivery of Cisco cryptographic products does not implythird-party authority to import, export, distribute or use encryption.Importers, exporters, distributors and users are responsible forcompliance with U.S. and local country laws. By using this product youagree to comply with applicable laws and regulations. If you are unableto comply with U.S. and local laws, return this product immediately.
A summary of U.S. laws governing Cisco cryptographic products may be found at:http://www.cisco.com/wwl/export/crypto/tool/stqrg.html
If you require further assistance please contact us by sending email toexport@cisco.com.
License Information for 'WS-X45-SUP8-E' License Level: ipbase Type: Permanent Next reboot license Level: ipbase
cisco WS-C4510R+E (P5040) processor (revision 2) with 4194304K bytes of physical memory.Processor board ID FXS1749Q1VP5040 CPU at 2.2GHz, Supervisor 8-ELast reset from Reload17 Virtual Ethernet interfaces336 Gigabit Ethernet interfaces20 Ten Gigabit Ethernet interfaces511K bytes of non-volatile configuration memory.
Configuration register is 0x2102
Step1: Configure Flow Record
flow record ipv4_record
match ipv4 protocol
match ipv4 source address
match ipv4 destination address
match transport source-port
match transport destination-port
collect ipv4 tos
collect transport tcp source-port
collect transport tcp destination-port
collect transport tcp flags
collect interface input
collect interface output
collect counter bytes
collect counter packets
collect timestamp sys-uptime first
collect timestamp sys-uptime last
Step2: Configure Flow Exporter
flow exporter flow1
description for vlan 1
destination 10.4.2.13
source Vlan1
transport udp 9995
template data timeout 60
Step3: Configure Flow Monitor
flow monitor main_monitor
exporter flow1
cache timeout active 30
record ipv4_record
Step4: Applying an IPv4 Flow Monitor to an Interface
interface GigabitEthernet1/4
ip flow monitor main_monitor input
end
Step5: Configure PRTG Server (10.4.2.13) to Receive the flow data on UDP port 9995
This Step is same as my previous post "Configure Netflow on network devices for PRTG Netflow Monitoring"Add a new Sensor at this Switch Device and put Vlan 1 ip address into Sendor IP. Receive NetFlow Packets on UDP port is 9995.
Step 6: Verify:
CS#show flow interface g1/4
Interface GigabitEthernet1/4
FNF: monitor: main_monitor
direction: Input
traffic(ip): on
CS#show flow monitor name main_monitor cache format record
Cache type: Normal
Cache size: 4096
Current entries: 451
High Watermark: 1024
Flows added: 681122
Flows aged: 680671
- Active timeout ( 30 secs) 51744
- Inactive timeout ( 15 secs) 628927
- Event aged 0
- Watermark aged 0
- Emergency aged 0
IPV4 SOURCE ADDRESS: 10.31.51.9
IPV4 DESTINATION ADDRESS: 10.4.1.15
TRNS SOURCE PORT: 52034
TRNS DESTINATION PORT: 1352
IP PROTOCOL: 6
tcp source port: 52034
tcp destination port: 1352
tcp flags: 0x18
interface input: Gi1/4
interface output: Gi10/24
counter bytes: 7060
counter packets: 20
timestamp first: 03:05:59.637
timestamp last: 03:06:24.637
ip tos: 0x00
Notes:
1. The Flexible NetFlow in Cisco 4500 requires you to configure your own “record” since there are no predefined ones available like in some other IOS.2. Interface Flow monitor output does not support on Cisco 4500 switch yet.
CS(config-if)#ip flow monitor main_monitor output3. Traditional Netflow V5 and V9 configuration:
% Flow Monitor: 'main_monitor' could not be added to interface due to invalid sub-traffic type: 0
This feature is only available if the NetFlow Services Card (WS-F4531) is present. The modules can be viewed by executing the “show module” command.
For example:
Mod Submodule Model Serial No. Hw Status
----+-----------------------+-----------------+------------+----+---------
1 Netflow Services Card WS-F4531 JAB062209CG 0.2 Ok
2 Netflow Services Card WS-F4531 JAB062209AG 0.2 Ok
The basic command set is as follows:
ip flow ingress infer-fields
ip flow-cache timeout active 1
ip flow-export source Loopback0
ip flow-export version 5
ip flow-export destination x.x.x.x 2059
Reference:
1. Configuring Flexible NetFlow Export on Cisco Routers2. Cisco IOS Flexible NetFlow Technology Q&A
3. What is Flexible NetFlow part 1 of 3
Tuesday, February 3, 2015
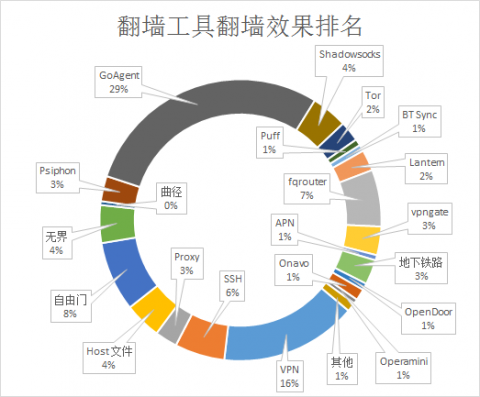
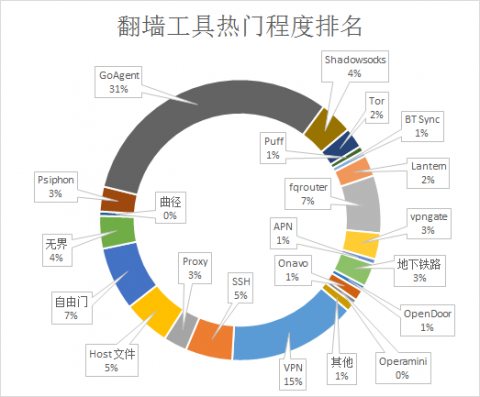
Free Software Across the Great Firewall (免费翻墙软件)
All information are collected from Internet.


From: https://pao-pao.net/article/111
从2015年1月1日开始的,Chinese GFW升级,很多免费翻墙软件相继失效. Here are some may still working:
1. 自*由*门
翻墙软件中的“常青树”。最新版本7.52依然好用,就是速度稍微慢了一点。How to Use Link: 翻墙七种武器之多情环:自由门与无界
2. 无*界*浏*览*14.04
无界,几乎算作自由门的姐妹款,是由美国无界万国公司创建在GIFT技术平台上的免费软件,也是由海外法轮功学院所开发,和动态网同属于美国自由网络联盟,曾经被哈弗大学在2007年的研究调查中被评为“效果最好的翻墙工具”. Usage is same as 自由门.3. 赛风(Psiphon)
“Psiphon”,官方中文译名为赛风,民间早期译作白凤或彩虹,是一款可以突破网络审查的自由软件,其遵循GPL协议,于2006年12月1日发布。它是由开放网络基金资助、多伦多大学的公民实验室(Citizen Lab)开发。Psiphon 分为数个版本,Psiphon 2 是网页版代理,Psiphon 3 是利用VPN和HTTP代理技术的软件,支持Android及Microsoft Windows系统。Psiphon3提供SSH+,VPN,SSH三个通道可供翻墙。速度比较快,就是不太稳定,偶尔断线,不过断线后软件会自动寻找新的可用服务器。How to use link: 翻墙七种武器之新多情环:Psiphon赛风
http://www.psiphon3.com
4. 蓝灯(Lantern)
基于P2P的新型翻墙软件,美国国务院资助项目。可以添加信任的好友到自己的网络,使翻墙速度更快、更不容易被封锁!Websites:
https://github.com/getlantern/lantern/
https://getlantern.org/
https://github.com/getlantern/lantern/wiki/欢迎
https://groups.google.com/forum/#!forum/lantern-devel
https://github.com/getlantern/lantern/releases
https://github.com/getlantern/lantern/
https://getlantern.org/
https://github.com/getlantern/lantern/wiki/欢迎
https://groups.google.com/forum/#!forum/lantern-devel
https://github.com/getlantern/lantern/releases
* 本文原文链接:蓝灯 Lantern – v1.5.8(2014-11-5) – 美博园 *
Latest Lantern Release v.1.5.8 (2014-11-5)
http://lantern.s3.amazonaws.com/lantern-1.5.8-30ad4bd.exe (Windows XP SP3 and above)
http://lantern.s3.amazonaws.com/lantern-1.5.8-30ad4bd.dmg (OX 10.7 and above)
http://lantern.s3.amazonaws.com/lantern-1.5.8-30ad4bd-32-bit.deb (Ubuntu 14.04 and above 32 bit)
http://lantern.s3.amazonaws.com/lantern-1.5.8-30ad4bd-64-bit.deb (Ubuntu 14.04 and above 64 bit)
How to use Link: 翻墙 | 蓝灯 Lantern – v1.5.8
5. GoAgent
这个不用我多说了吧,基于Google App Engine(GAE)的翻墙利器。稳定、速度快、难以被封锁。可就是配置起来相对复杂一点,不属于傻瓜式的翻墙软件。How to use Link: 翻墙七种武器之长生剑:GoAgent
6. Ultrasurf
Ultrasurf is a product of Ultrareach Internet Corporation. Originally created to help internet users in China find security and freedom online, Ultrasurf has now become one of the world's most popular anti-censorship, pro-privacy software, with millions of people using it to bypass internet censorship and protect their online privacy.7. Autoproxy - the smart firefox proxy management add-on
8. 萤火虫翻墙代理(Firefly-proxy)

翻墙新利器:萤火虫代理
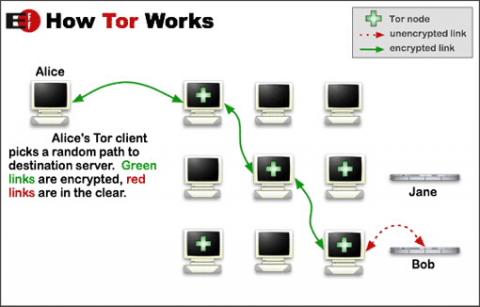
9. Tor
TorProject已经推出了以 Firefox ESR 的专属浏览器: Tor Browser Bundle(简称TBB),将Tor和 Firefox 浏览器进行捆绑,使用者只需要通过网站下载 最新的4.0 版本到本地,解压缩安装以后就可以直接上网浏览,省去了其中复杂繁琐的过程。How to Use Link: Tor“重返”中国:翻墙与进入“深网”
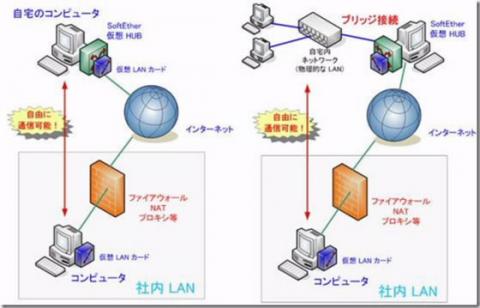
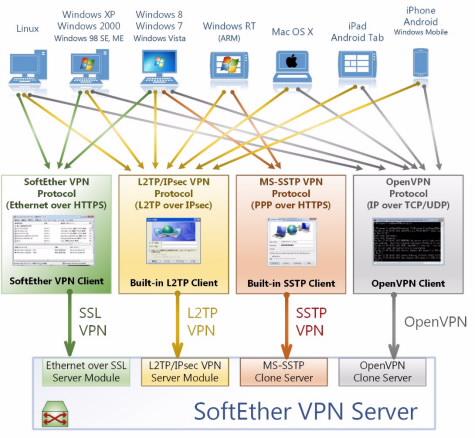
10. SoftEther and VPN Gate
vpngate.net 的镜像站点列表 (更新于 2014-04-15 01:09:08 UTC):
· 镜像地址:美国
· 镜像地址:日本
· 镜像地址:韩国
· 镜像地址:越南
· 镜像地址:日本
How to Use Link:
Reference:
Subscribe to:
Posts (Atom)