Pages

Wednesday, August 26, 2015

Checkpoint Monitord Process Consumes Excess Memory

During a regular review firewall mem and cpu usage, I found some of Checkpoint UTM272 R77.10 gateways are using lots memory and ssh / snmp access seems slow sometimes. With the TOP command , I am able to sort the mem / cpu usage and see who is hogging the resources.

The result of finding is monitord service. Monitord server is used by device sensors to monitor hardware and saves data into DB file stored on local. Before R76, it will keep one year data in DB. After R76, it only keeps 3 months history to save devices resources during process the data. In my case, the DB file is more than 350M which cause monitord service consumes lots memory to process DB file. Although we are using R77.10, it seems upgrading to R771.10, not fresh installation,  wont reset your DB file structure.

There is workaround provided at SK93587. Here are all steps I recorded to fix this.


1. Before applied the workaround, monitord is using 42.5% MEM.


top - 10:56:37 up 10 days,  1:08,  1 user,  load average: 0.00, 0.06, 0.43
Tasks:  83 total,   3 running,  80 sleeping,   0 stopped,   0 zombie
Cpu(s):  1.2%us,  1.1%sy,  0.0%ni, 97.3%id,  0.2%wa,  0.1%hi,  0.1%si,  0.0%st
Mem:    957272k total,   947392k used,     9880k free,     2772k buffers
Swap:  2096472k total,    43292k used,  2053180k free,   209280k cached
%MEM   PID USER      PR  NI  VIRT  RES  SHR S %CPU    TIME+  COMMAND             
 5.0  4226 admin     15   0  263m  47m  11m S  0.4  59:12.98 cpd                 
 0.1  2782 admin     15   0  2172 1084  836 R  0.2   0:00.05 top                 
 0.8  3988 admin     15   0 24344 7956 5780 S  0.2  22:38.83 snmpd               
 1.4  3947 admin     16   0 33796  13m 7964 S  0.1   2947:10 confd               
42.5  3952 admin     15   0  400m 397m 2332 S  0.1 119:05.53 monitord            
 0.1  3545 admin     18   0  1708  688  584 S  0.1   2:38.13 syslogd             
 0.1     1 admin     15   0  2040  580  548 S  0.0   0:01.47 init                
 0.0     2 admin     RT  -5     0    0    0 S  0.0   0:00.00 migration/0         
 0.0     3 admin     15   0     0    0    0 S  0.0   0:00.67 ksoftirqd/0         
 0.0     4 admin     RT  -5     0    0    0 S  0.0   0:00.00 watchdog/0          
 0.0     5 admin     10  -5     0    0    0 S  0.0   0:01.56 events/0                                                                                             


Next is the top outputs sorted by %MEM:              
top - 10:58:15 up 10 days,  1:10,  1 user,  load average: 0.00, 0.04, 0.38
Tasks:  83 total,   3 running,  80 sleeping,   0 stopped,   0 zombie
Cpu(s):  0.3%us,  0.3%sy,  0.0%ni, 99.0%id,  0.3%wa,  0.0%hi,  0.0%si,  0.0%st
Mem:    957272k total,   947972k used,     9300k free,     3036k buffers
Swap:  2096472k total,    43292k used,  2053180k free,   209708k cached

%MEM   PID USER      PR  NI  VIRT  RES  SHR S %CPU    TIME+  COMMAND             
42.5  3952 admin     15   0  400m 397m 2332 S  0.3 119:05.63 monitord            
 6.9  6938 admin     19   0  122m  64m 3836 S  0.0  19:09.09 DAService           
 5.0  4226 admin     15   0  263m  47m  11m S  0.0  59:13.25 cpd                 
 2.0  4386 admin     15   0  284m  18m  10m S  0.0   1:23.18 fw_full             
 1.5  3948 admin     15   0 38032  13m 1704 S  0.0  70:42.63 searchd             
 1.4  3947 admin     15   0 33796  13m 7964 S  0.0   2947:10 confd               
 1.4  6779 admin     15   0  163m  13m 7252 S  0.0   0:03.49 rtmd                
 0.8  3988 admin     15   0 24344 7956 5780 S  0.0  22:39.07 snmpd                

2. Rebuild monitord DB

[Expert@CP-DMZ-1:0]# tellpm process:monitord
[Expert@CP-DMZ-1:0]# 
Message from syslogd@ at Wed Aug 26 10:59:39 2015 ...
CP-DMZ-1 monitord[3952]: monitord got killed 
[Expert@CP-DMZ-1:0]# top  (Sorted result by %MEM)
                 
top - 11:00:09 up 10 days,  1:12,  1 user,  load average: 0.00, 0.02, 0.33
Tasks:  82 total,   2 running,  80 sleeping,   0 stopped,   0 zombie
Cpu(s):  2.3%us,  1.7%sy,  0.0%ni, 95.7%id,  0.3%wa,  0.0%hi,  0.0%si,  0.0%st
Mem:    957272k total,   542928k used,   414344k free,     3620k buffers
Swap:  2096472k total,    42700k used,  2053772k free,   208824k cached

  PID USER      PR  NI  VIRT  RES  SHR S %CPU %MEM    TIME+  COMMAND             
 6938 admin     19   0  122m  64m 3836 S  0.0  6.9  19:09.09 DAService           
 4226 admin     15   0  263m  47m  11m S  1.0  5.0  59:13.62 cpd                 
 4386 admin     15   0  284m  18m  10m S  0.0  2.0   1:23.18 fw_full             
 3948 admin     15   0 38032  13m 1704 S  0.0  1.5  70:42.63 searchd             
 3947 admin     15   0 33796  13m 7968 S  0.0  1.4   2947:10 confd               
 6779 admin     15   0  163m  13m 7252 S  0.0  1.4   0:03.49 rtmd                
 3930 admin     15   0 25300 7996 6340 S  0.0  0.8   0:00.41 pm                  
 3988 admin     15   0 24344 7956 5780 S  0.3  0.8  22:39.35 snmpd               
 4339 admin     15   0  149m 7352 5748 S  0.0  0.8   0:00.51 cphamcset           
 4367 admin     15   0 32944 7224 6472 S  0.0  0.8   1:09.32 routed              
 4374 admin     16   0 33044 7168 6976 S  0.0  0.7   0:13.16 routed              
 3951 admin     18   0 99768 7024 6620 S  0.0  0.7   0:06.79 rconfd              
 3983 admin     17   0 25272 6816 6136 S  0.0  0.7   0:00.34 cloningd            
 2228 admin     15   0 21000 5972 3324 S  0.0  0.6   0:00.52 clish               
 4240 admin     15   0  150m 5732 5592 S  0.0  0.6   0:00.75 mpdaemon                                                                                                                                                              
[Expert@CP-DMZ-1:0]# cd /var/log
[Expert@CP-DMZ-1:0]# ls -l db
-rw-r--r-- 1 admin root 356237312 Aug 26 10:45 db
[Expert@CP-DMZ-1:0]# cp /var/log/db  /var/log/db_ORIGINAL
[Expert@CP-DMZ-1:0]#  sqlite3 /var/log/db 
SQLite version 3.6.20
Enter ".help" for instructions
Enter SQL statements terminated with a ";"
sqlite> VACUUM;
sqlite> .exit 
[Expert@CP-DMZ-1:0]# tellpm process:monitord t
[Expert@CP-DMZ-1:0]# 


3. Check Memory usage after workaround applied

The memory usage has been reduced to only 4.9%, dropped from 42.5% we found from Step 1

top - 11:15:24 up 10 days,  1:27,  1 user,  load average: 0.00, 0.05, 0.18
Tasks:  83 total,   2 running,  81 sleeping,   0 stopped,   0 zombie
Cpu(s):  0.7%us,  0.3%sy,  0.0%ni, 98.3%id,  0.0%wa,  0.3%hi,  0.3%si,  0.0%st
Mem:    957272k total,   446428k used,   510844k free,     4808k buffers
Swap:  2096472k total,    42696k used,  2053776k free,    67228k cached

  PID USER      PR  NI  VIRT  RES  SHR S %CPU %MEM    TIME+  COMMAND             
 6938 admin     17   0  122m  64m 3836 S  0.0  6.9  19:09.09 DAService           
 4226 admin     15   0  263m  47m  11m S  0.0  5.0  59:16.10 cpd                 
 3088 admin     15   0 49684  45m 2320 S  0.0  4.9   0:01.55 monitord            
 4386 admin     15   0  284m  18m  10m S  0.0  2.0   1:23.23 fw_full             
 3948 admin     15   0 38032  13m 1704 S  0.0  1.5  70:42.63 searchd             
 3947 admin     15   0 33796  13m 7968 S  0.0  1.4   2947:10 confd               
 6779 admin     15   0  163m  13m 7252 S  0.0  1.4   0:03.49 rtmd                
 3930 admin     16   0 25300 8012 6340 S  0.0  0.8   0:00.41 pm                  
 3988 admin     15   0 24344 7956 5780 S  0.0  0.8  22:41.56 snmpd               
 4339 admin     15   0  149m 7352 5748 S  0.0  0.8   0:00.51 cphamcset           
 4367 admin     15   0 32944 7224 6472 S  0.0  0.8   1:09.33 routed              
 4374 admin     15   0 33044 7168 6976 S  0.0  0.7   0:13.19 routed              
 3951 admin     18   0 99768 7024 6620 S  0.0  0.7   0:06.79 rconfd              
 3983 admin     17   0 25272 6816 6136 S  0.0  0.7   0:00.34 cloningd            
 2228 admin     15   0 21000 5972 3324 S  0.0  0.6   0:00.52 clish               
 4240 admin     15   0  150m 5732 5592 S  0.0  0.6   0:00.75 mpdaemon            
 4787 admin     18   0 20936 5512 5508 S  0.0  0.6   0:00.28 cpviewd             
 4347 nobody    17   0 18748 5108 5104 S  0.0  0.5   0:00.21 ci_http_server        
And the DB size reduced from more than 350M to less than 40M

[Expert@CP-DMZ-1:0]# ls -l db
-rw-r--r-- 1 admin root 37168128 Aug 26 11:32 db


Reference: 

sk93587 - Output of 'top' command on Gaia OS shows that 'monitord' process consumes memory or CPU at high level


Monday, August 17, 2015

Update to Windows 10 Immediately Without Wait Validating from Microsoft

One of my windows 7 laptop is still waiting Microsoft to validate my computer's specific but my another one has been notified and successfully automatically updated. After a couple of  weeks waiting, this weekend I lost patience and decided to find other ways to update my windows 7 to windows 10.

Validating Windows 10 for your PC


One way I found is to use Microsoft media creation tool. Microsoft has provided a URL to download software for those who do not want to wait and want to update to win10 by themselves: http://www.microsoft.com/en-us/software-download/windows10 .

This Microsoft URL provides 32-bit version and 64-bit version tools for different devices. A blank USB or DVD (and DVD burner) with at least 4 GB of space will be needed if you want to create media.

Since my laptop is running on 32-bit version Windows 7, I downloaded this 32-bit tool MediaCreationTool.exe. When ran it, something happened (Something happened 0x80070490 - 0x20016) windows shows up.
Error: Something happened 0x80070490 - 0x20016

After searched Internet I found there is a useful tip to fix this annoying and meaningless error message.

By adding a new  DWORD (32-bit) AllowOSUpgrade value 1 under registry tree \\Computer\HKEY_LOCAL_MACHINE\SOFTWARE\Microsoft\Windows\CurrentVersion\WindowsUpdate\OSUpgrade, it will enable automatically windows update to download windows 10 into your machine.

AllowOSUpgrade value in Regedit
After closed Registry Editor window opened by command Regedit, Windows update automatically started to download Windows 10 updates.
Downloading Windows 10
After download 100% completed, it started the process to prepare for Windows 10 installation.
Preparing for Windows 10 installation

You may get a license agreement window, accept it, windows will ask you to reboot your machine to start this update. Waiting updating for around 30 minutes, there are a couple of rebooting during whole process. You machine's screen will show percentage and notify you where the procedures is. Eventually you will get into lovely Windows 10 screen.


Reference:
How to fix the Something Happened 0x80070002 – 0x20016 error and upgrade to Windows 10


Sunday, August 16, 2015

Checkpoint Gateway Lost SIC After Jumbo Hotfix Installed

Our Checkpoint Products are stilling sitting at R77.10. Checkpoint has release Jumbo Hotfix Accumulator for R77.10 (gypsy_hf_base_021).

The installation procedures from Command Line is quite simple:
  1. Transfer the Jumbo Hotfix Accumulator to the machine /var/tmp folder
  2. Unpack the Jumbo Hotfix Accumulator:

    [Expert@CP-1]# cd /var/tmp
    [Expert@CP-1]# tar zxvf Check_Point_R77.10.linux.tgz
  3. Install the Jumbo Hotfix Accumulator:
    [Expert@CP-1]# ./UnixInstallScript

    Note: The script will stop all of Check Point services (cpstop) - read the output on the screen.
  4. Reboot the machine.
  5. Verify Installation with Command "cpinfo -y all"

    Symptoms: 


    I followed those steps and installed this Jumbo Hotfix on both cluster members at the same time also rebooted them at the same time. But after waited a couple of minutes, one of cluster members shows disconnected from Smartview Monitor.


    When I ssh-ed into device and checked cluster status it shows ok. Also I were able to reach management server interface from problem cluster member. From the output of "cpinfo -y all " also shows the hotfix has been installed correctly. 

    [Expert@CP-DMZ-1:0]# cpinfo -y all
    ------------------------
    Hotfix versions
    ------------------------
    [FW1] 
      HOTFIX_R77_10 
      HOTFIX_R77_HF_HA10_005 
      HOTFIX_GYPSY_HF_BASE_021 

    [SecurePlatform] 
      HOTFIX_R77_10_GAIA_GHOST_833 
      HOTFIX_GYPSY_HF_BASE_021 

    [SPSHARED] 
      No hotfixes..

    [CVPN] 
      HOTFIX_R77_10 
      HOTFIX_GYPSY_HF_BASE_021 

    [PPACK] 
      HOTFIX_R77_10 
      HOTFIX_GYPSY_HF_BASE_021 

    [CPinfo] 
      No hotfixes..

    [SmartLog] 
      HOTFIX_R77_10 

    [rtm] 
      No hotfixes..

    Troubleshooting:


    I went back to SmartDashboard and checked SIC status and found it was out of SIC. I was confusing what could cause the SIC lost from this cluster member. Should I reset SIC?

    SmartView Tracker saved me this time. There is one log shows firewall policy inconsistencies existing between cluster members.


    Number:             7250420
    Date:                 16Aug2015
    Time:                 10:09:07
    Origin:               CP-DMZ-1
    Type:                 Log
    Action:              
    Information:       sync: Inconsistencies exist between policies installed on the cluster members. Please reinstall the policy on the cluster.
    Product:             Security Gateway/Management
    Product Family: Network
    Policy Info:         Policy Name: defaultfilter
                              Created at: Sun Aug 16 07:12:25 2015
                              Installed from: CP-Management

    Solutions:

    I quickly pushed policy to cluster and it was failed because SIC error as shown below.


    Amazing thing is this firewall policy push resolved SIC issue. Both firewall cluster members show green and OK status in Smartview Monitor. 

    Layer 2 / Layer 3 IP Packets Switching Procedures

    Layer 2 Packets Switching Procedures

    The packet will be sent in the same vlan.

    1. A sends ARP -who is 10.1.1.3?
    Destination MAC address : ALL FF's
    Source MAC address: A1

    2. ARP is broadcast so switch forwards out all ports

    3. B replies to ARP
    Destination MAC:A1
    Source MAC: B1

    4. A sends to B
    Destination MAC: B1
    Source MAC: A1
    Destination IP address: 10.1.1.3
    Souce IP: 10.1.1.2

    5. Switch performs CAM lookup using destination mac address and forwards packet to B1.


    -----------------------------------------------------------------------------------------------------------

    Layer 2 / Layer3 IP Switching Procedures

    Packets will send from A to D across multiple vlans:


    1. A sends ARP - who is 10.5.1.2?
    Destination MAC address : ALL FF's
    Source MAC address: A1

    2. Switch replies to ARP - saying send it to me

    3. A sends to Switch
    Destination MAC: C1
    Source MAC: A1
    Destination IP: 10.5.1.2
    Souce IP: 10.1.1.2


    4.Switch does a L3 lookup 

    5. Packet forwarded
    Destination MAC: D1
    Souce MAC: C3
    Destination IP: 10.5.1.2
    Source IP:10.1.1.2

    6. Switch does a forwarding lookup

    7: Packet forwarded
    Destination MAC: F2
    Source MAC: D2
    Destination IP: 10.5.1.2
    Souce IP: 10.1.1.2


    Saturday, August 15, 2015

    Policy Based IPSec VPN Configuration Between SRX Firewalls

    Juniper SRX support both Route-based and Policy-based VPN, which can be used in different scenarios based on your environments and requirements. 


    Difference between them (KB15745)

    With policy-based VPN tunnels, a tunnel is treated as an object that together with source, destination, application, and action, comprises a tunnel policy that permits VPN traffic. In a policy-based VPN configuration, a tunnel policy specifically references a VPN tunnel by name.

    With route-based VPNs, a policy does not specifically reference a VPN tunnel. Instead, the policy references a destination address. When the security device does a route lookup to find the interface through which it must send traffic to reach that address, it finds a route via a secure tunnel (ST) interface, which is bound to a specific VPN tunnel.

    Thus, with a policy-based VPN tunnel, you can consider a tunnel as an element in the construction of a policy. With a route-based VPN tunnel, you can consider a tunnel as a means for delivering traffic, and the policy as a method for either permitting or denying the delivery of that traffic.


    Scenarios to use them:  

    The following are reasons why you implement route-based VPN:
    • Source or destination NAT (NAT-src or NAT-dst) needs to occur as traffic travels through the VPN.
    • There are overlapping subnets or IP addresses between the two LANs.
    • Hub-and-spoke VPN topology is used in the network.
    • Primary and backup VPN are required.
    • A dynamic routing protocol (for example, OSPF, RIP, or BGP) is running across the VPN.
    • Multiple subnets or networks at the remote site across the VPN need to be accessed.
    The following are reasons why you implement policy-based VPN:
    • The remote VPN device is a non-Juniper device.
    • Only one subnet or one network at the remote site across the VPN needs to be accessed.

    Route-Based VPN Configuration Procedures

    My previous posts (Using PKI Build Route-Based IPSec VPN between Juniper SRX) have shown the configuration Route-Based VPN between two SRX firewalls. This Post will present the procedures how to use policy-based VPN.

    Topology:


    Two Juniper SRX Firewalls.
    FW1:
    External Interface Reth0.0 = 192.168.9.18
    Internal Interface Reth1.0 = 10.94.138.18

    FW2:
    External Interface Reth0.0 = 10.99.132.18
    Internal Interface Reth1.0 = 10.99.136.18

    VPN will be built between FW1 and FW2. Firewall Policy will use VPN tunnel for traffic between 10.94.138.0/24 and 10.99.136.0/24

    We will generate traffic between two machines 10.94.138.21 and 10.99.136.16 to test this vpn configuration on FW1 and FW2.

    Step 1: routing between 10.94.132.18 and 192.168.9.18

    @FW1:
    admin@fw1> show configuration routing-options
    static {
        route 0.0.0.0/0 next-hop 10.94.12.1;   /* this is fxp0.0 mgmt interface*/
        route 10.99.132.0/24 next-hop 192.168.9.1;   /* this route added to reach vpn peer gateway*/
    }

    @FW2
    admin@fw2> show configuration routing-options 
    static {
        route 0.0.0.0/0 next-hop 10.99.12.1;
        route 192.168.9.0/24 next-hop 10.99.132.1;
    }

    Step 2: Phase 1 IKE configuration

    @FW1:

    ike {

        proposal ike-p1-proposal {
            authentication-method pre-shared-keys;
            dh-group group2;
            authentication-algorithm sha1;
            encryption-algorithm aes-128-cbc;
        }
        policy ike-p1-policy {
            mode main;
            proposals ike-p1-proposal;
            pre-shared-key ascii-text "$9$O/-1REyXxdsgJSds2gJZn/9p1RylK"; ## SECRET-DATA
        }
        gateway gw-montreal-pin {        
            ike-policy ike-p1-policy;
            address 10.99.132.18;
            external-interface reth0.0;
        }
    }
    @FW2

    ike {

        proposal ike-p1-proposal {
            authentication-method pre-shared-keys;
            dh-group group2;
            authentication-algorithm sha1;
            encryption-algorithm aes-128-cbc;
        }
        policy ike-p1-policy {
            mode main;
            proposals ike-p1-proposal;
            pre-shared-key ascii-text "$9$MkgXxdaJDmT7-Dk.mTQEcSe8Xdbs"; ## SECRET-DATA
        }
        gateway gw-k-pin {          
            ike-policy ike-p1-policy;
            address 192.168.9.18;
            external-interface reth0.0;
        }
    }

    Step 3: Phase 2 IPSec configuration

    @FW1:

    ipsec {

        proposal ipsec-p1-proposal {
            protocol esp;
            authentication-algorithm hmac-sha-256-128;
            encryption-algorithm aes-128-cbc;
            lifetime-seconds 3600;
        }
        policy ipsec-p2-policy {
            perfect-forward-secrecy {
                keys group2;
            }
            proposals ipsec-p1-proposal;
        }
        vpn ike-vpn-m {
            ike {
                gateway gw-m-pin;
                ipsec-policy ipsec-p2-policy;
            }
        }
    }

    @FW2

    ipsec {

        proposal ipsec-p1-proposal {
            protocol esp;
            authentication-algorithm hmac-sha-256-128;
            encryption-algorithm aes-128-cbc;
        }
        policy ipsec-p2-policy {
            perfect-forward-secrecy {
                keys group2;
            }
            proposals ipsec-p1-proposal;
        }
        vpn ike-vpn-k {
            ike {
                gateway gw-k-pin;
                ipsec-policy ipsec-p2-policy;
            }
        }
    }

    Step 4: Policy Configuration

    @FW1:
        from-zone T to-zone D {
            policy p-vpn-1 {
                match {
                    source-address n_10.94.138.0-24;
                    destination-address n_10.99.136.0-24;
                    application any;
                }
                then {
                    permit {
                        tunnel {
                            ipsec-vpn ike-vpn-m;
                            pair-policy p-vpn-2;
                        }
                        application-services {
                            idp;
                        }
                    }
                    log {
                        session-close;
                    }
                }
            }
            policy 7 {
                match {
                    source-address any;
                    destination-address any;
                    application any;
                }
                then {
                    deny;
                }
            }
        }
        from-zone D to-zone T {
            policy p-vpn-2 {
                match {
                    source-address n_10.99.136.0-24;
                    destination-address n_10.94.138.0-24;
                    application any;
                }
                then {
                    permit {
                        tunnel {
                            ipsec-vpn ike-vpn-m;
                            pair-policy p-vpn-1;
                        }
                        application-services {
                            idp;
                        }
                    }
                    log {
                        session-close;
                    }
                }
            }
            policy 9 {
                match {
                    source-address any;
                    destination-address any;
                    application any;
                }
                then {
                    deny;
                }
            }
        }
    }

    @FW2

    from-zone D to-zone P {
        policy p-vpn-1 {
            match {
                source-address n_10.94.138.0-24;
                destination-address n_10.99.136.0-24;
                application any;
            }
            then {
                permit {
                    tunnel {
                        ipsec-vpn ike-vpn-markham;
                        pair-policy p-vpn-2;
                    }
                }
            }
        }
        policy 3 {
            match {
                source-address any;
                destination-address any;
                application any;
            }
            then {
                deny;
            }
        }
    }
    from-zone P to-zone D {
        policy p-vpn-2 {
            match {
                source-address n_10.99.136.0-24;
                destination-address n_10.94.138.0-24;
                application any;
            }
            then {
                permit {
                    tunnel {
                        ipsec-vpn ike-vpn-markham;
                        pair-policy p-vpn-1;
                    }
                }
            }
        }
        policy 4 {
            match {
                source-address any;
                destination-address any;
                application any;
            }
            then {
                deny;
            }
        }
    }

    Verification:

    Ping between 10.99.136.16 and 10.94.138.21 is not working. That means unfortunately with those above configuration, the vpn tunnel is still not able up.

    Troubleshooting:

    admin@SRX-fw2# show | compare    
    [edit security]
    +   flow {
    +       traceoptions {
    +           file J1;
    +           flag basic-datapath;
    +           packet-filter Match-Traffic {
    +               source-prefix 10.99.136.9/32;
    +               destination-prefix 10.94.138.21/32;
    +           }
    +       }
    +   }

    admin@SRX-fw2# run show log J1
    Aug 14 21:37:46 21:37:46.231681:CID-1:RT:filter 1 name Match-Traffic2 is set
    Aug 14 21:37:46 21:37:46.231068:CID-1:CTRL:flow1: Rate limit changed to 0
    Aug 14 21:37:46 21:37:46.231561:CID-1:CTRL:flow11: Destination ID set to 2
    Aug 14 21:37:55 21:37:55.341589:CID-2:RT:<10.99.136.9/1->10.94.138.21/50019;1> matched filter Match-Traffic:
    Aug 14 21:37:55 21:37:55.341589:CID-2:RT:packet [72] ipid = 50020, @0x436a041cAug 14 21:37:55 21:37:55.341589:CID-2:RT:---- flow_process_pkt: (thd 3): flow_ctxt type 15, common flag 0x0, mbuf 0x436a0200, rtbl_idx = 0Aug 14 21:37:55 21:37:55.341589:CID-2:RT: flow process pak fast ifl 68 in_ifp reth1.0
    Aug 14 21:37:55 21:37:55.341589:CID-2:RT:  reth1.0:10.99.136.9->10.94.138.21, icmp, (8/0)
    Aug 14 21:37:55 21:37:55.341589:CID-2:RT: find flow: table 0x59b36da8, hash 34415(0xffff), sa 10.99.136.9, da 10.94.138.21, sp 1, dp 50019, proto 1, tok 7
    Aug 14 21:37:55 21:37:55.341589:CID-2:RT:  no session found, start first path. in_tunnel - 0x0, from_cp_flag - 0
    Aug 14 21:37:55 21:37:55.341589:CID-2:RT:  flow_first_create_session
    Aug 14 21:37:55 21:37:55.341589:CID-2:RT:  flow_first_in_dst_nat: in <reth1.0>, out <N/A> dst_adr 10.94.138.21, sp 1, dp 50019                      
    Aug 14 21:37:55 21:37:55.341589:CID-2:RT:  chose interface reth1.0 as incoming nat if.
    Aug 14 21:37:55 21:37:55.341589:CID-2:RT:flow_first_rule_dst_xlate: DST no-xlate: 0.0.0.0(0) to 10.94.138.21(50019)
    Aug 14 21:37:55 21:37:55.341589:CID-2:RT:flow_first_routing: vr_id 0, call flow_route_lookup(): src_ip 10.99.136.9, x_dst_ip 10.94.138.21, in ifp reth1.0, out ifp N/A sp 1, dp 50019, ip_proto 1, tos 0
    Aug 14 21:37:55 21:37:55.341890:CID-2:RT:Doing DESTINATION addr route-lookup
                                         
    Aug 14 21:37:55 21:37:55.341916:CID-2:RT:  routed (x_dst_ip 10.94.138.21) from P (reth1.0 in 1) to fxp0.0, Next-hop: 10.99.12.1
                                         
    Aug 14 21:37:55 21:37:55.341916:CID-2:RT:  packet dropped, out_ifp is null or in null-zone               
    Aug 14 21:37:55 21:37:55.341961:CID-2:RT:Out-ifp fxp0.0 is null or in null zone
    Aug 14 21:37:55 21:37:55.341961:CID-2:RT:  flow find session returns error.
    Aug 14 21:37:55 21:37:55.341961:CID-2:RT: ----- flow_process_pkt rc 0x7 (fp rc -1)
    Aug 14 21:37:55 21:37:55.814250:CID-2:RT:jsf sess close notify                          
    Aug 14 21:37:55 21:37:55.814302:CID-2:RT:flow_ipv4_del_flow: sess 69453, in hash 32
    Aug 14 21:37:55 21:37:55.814315:CID-2:RT:ha_ifp: fxp0.0
    Aug 14 21:38:04 21:38:04.521249:CID-2:RT:<10.99.136.9/0->10.94.138.21/1024;1> matched filter Match-Traffic:
    Aug 14 21:38:04 21:38:04.521249:CID-2:RT:packet [84] ipid = 9853, @0x4368eb9c

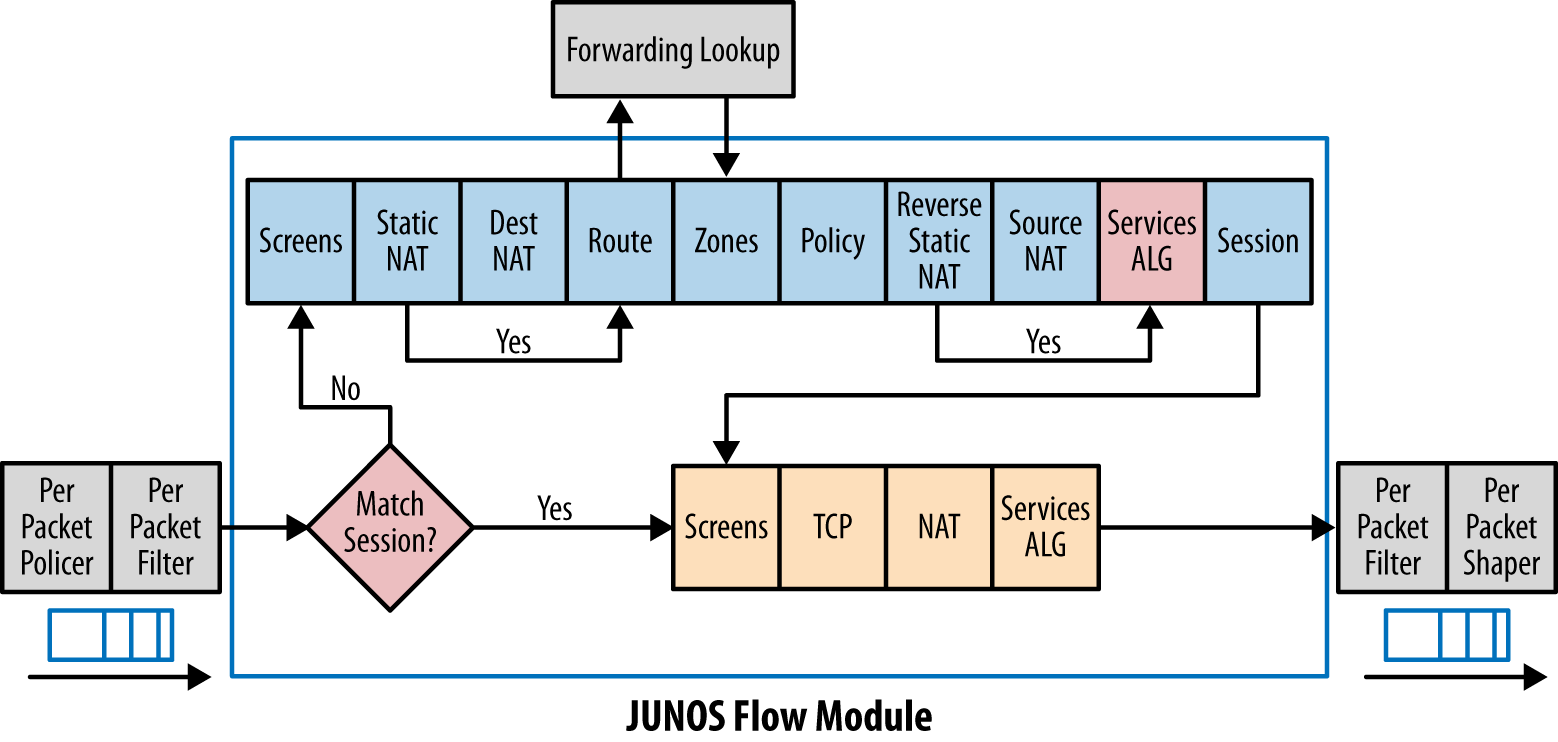
    It obviously the packets went out through fxp0.0. Basic my previous post How Firewalls (Security Gateways) Handle the Packets? (Traffic Flow) , for Juniper SRX firewall Routing Lookup happens before policy.
    In this case, before vpn policy is able to get packets into vpn tunnel , the packets went out firewall fxp0.0 interface by default route.

    admin@fw2# run show route
    inet.0: 9 destinations, 10 routes (9 active, 0 holddown, 0 hidden)
    + = Active Route, - = Last Active, * = Both

    0.0.0.0/0          *[Static/5] 1d 06:08:38
                        > to 10.99.12.1 via fxp0.0
    10.99.12.0/24      *[Direct/0] 1d 06:08:38
                        > via fxp0.0
                        [Direct/0] 1d 06:08:38
                        > via fxp0.0
    10.99.12.10/32     *[Local/0] 1d 06:08:38
                          Local via fxp0.0
    10.99.12.15/32     *[Local/0] 1d 06:08:38
                          Local via fxp0.0
    10.99.132.0/24     *[Direct/0] 1d 06:08:38
                        > via reth0.0
    10.99.132.18/32    *[Local/0] 1d 06:08:38
                          Local via reth0.0
    10.99.136.0/24     *[Direct/0] 1d 06:08:38
                        > via reth1.0
    10.99.136.18/32    *[Local/0] 1d 06:08:38
                          Local via reth1.0
    192.168.9.0/24     *[Static/5] 06:31:41
                        > to 10.99.132.1 via reth0.0

    Solutions:

    At this moment, firewall only has one specific route for peer gateway. Another specific static route will be added to route interesting  traffic through external interface.

    admin@fw2# show
    static {
        route 0.0.0.0/0 next-hop 10.99.12.1;
        route 192.168.9.0/24 next-hop 10.99.132.1;
    }

    john@fw-m-pin-b# set static route 10.94.138.0/24 next-hop 10.99.132.1

    After added this route, tunnel is up right away when testing with interesting traffic.

    {primary:node1}
    john@fw-m-pin-b> show security ike security-associations
    node1:
    --------------------------------------------------------------------------
    Index   State  Initiator cookie  Responder cookie  Mode           Remote Address
    11102161 UP    5184a7627510f777  bba6d0242cb15a30  Main           192.168.9.18  

    admin@fw2> show security ipsec security-associations
    node1:
    --------------------------------------------------------------------------
      Total active tunnels: 1
      ID    Algorithm       SPI      Life:sec/kb  Mon lsys Port  Gateway
      <2    ESP:aes-128/sha256 1cca52a5 3567/ unlim -  root 500   192.168.9.18  
      >2    ESP:aes-128/sha256 30b03088 3567/ unlim -  root 500   192.168.9.18  

    Reference:

    1. Using PKI Build Route-Based IPSec VPN between Juniper SRX
    2. Configuration Examples: Policy-based VPN