Pages

Sunday, August 13, 2017

Add a Read More button to Popular Blog Platforms

Having a read-more option in the posts can highly encourage  readers’ click-throughs and help you track your most popular entries. Adding read-more button is more than easy, this tutor post will show you how to Insert Read More Option on those popular blog websites such as Blogger, Tumblr, Weebly and WordPress.

1. Blogger


<!--more-->


2. Tumblr


The code is different from Blogger and Wordpress.

<p>[[MORE]]</p>

Note: Now at Rich text mode , Tumblr has a keyboard shortcut for the read more link. Press Command + Shift + K (Mac) or Ctrl + Shift + K (Windows), -----Keep reading---- line will be added into your cursor location.


3. Weebly

It is a little bit tricky to add read more link break into your post. You will have to create two separate Embed Code sections then add 'Read more Break' separator between. You wont be able to manually enter code into your html content of Embed Code section.


4. WordPress
Wordpress Read More code is same as blogger.

<!--more-->


Saturday, August 12, 2017

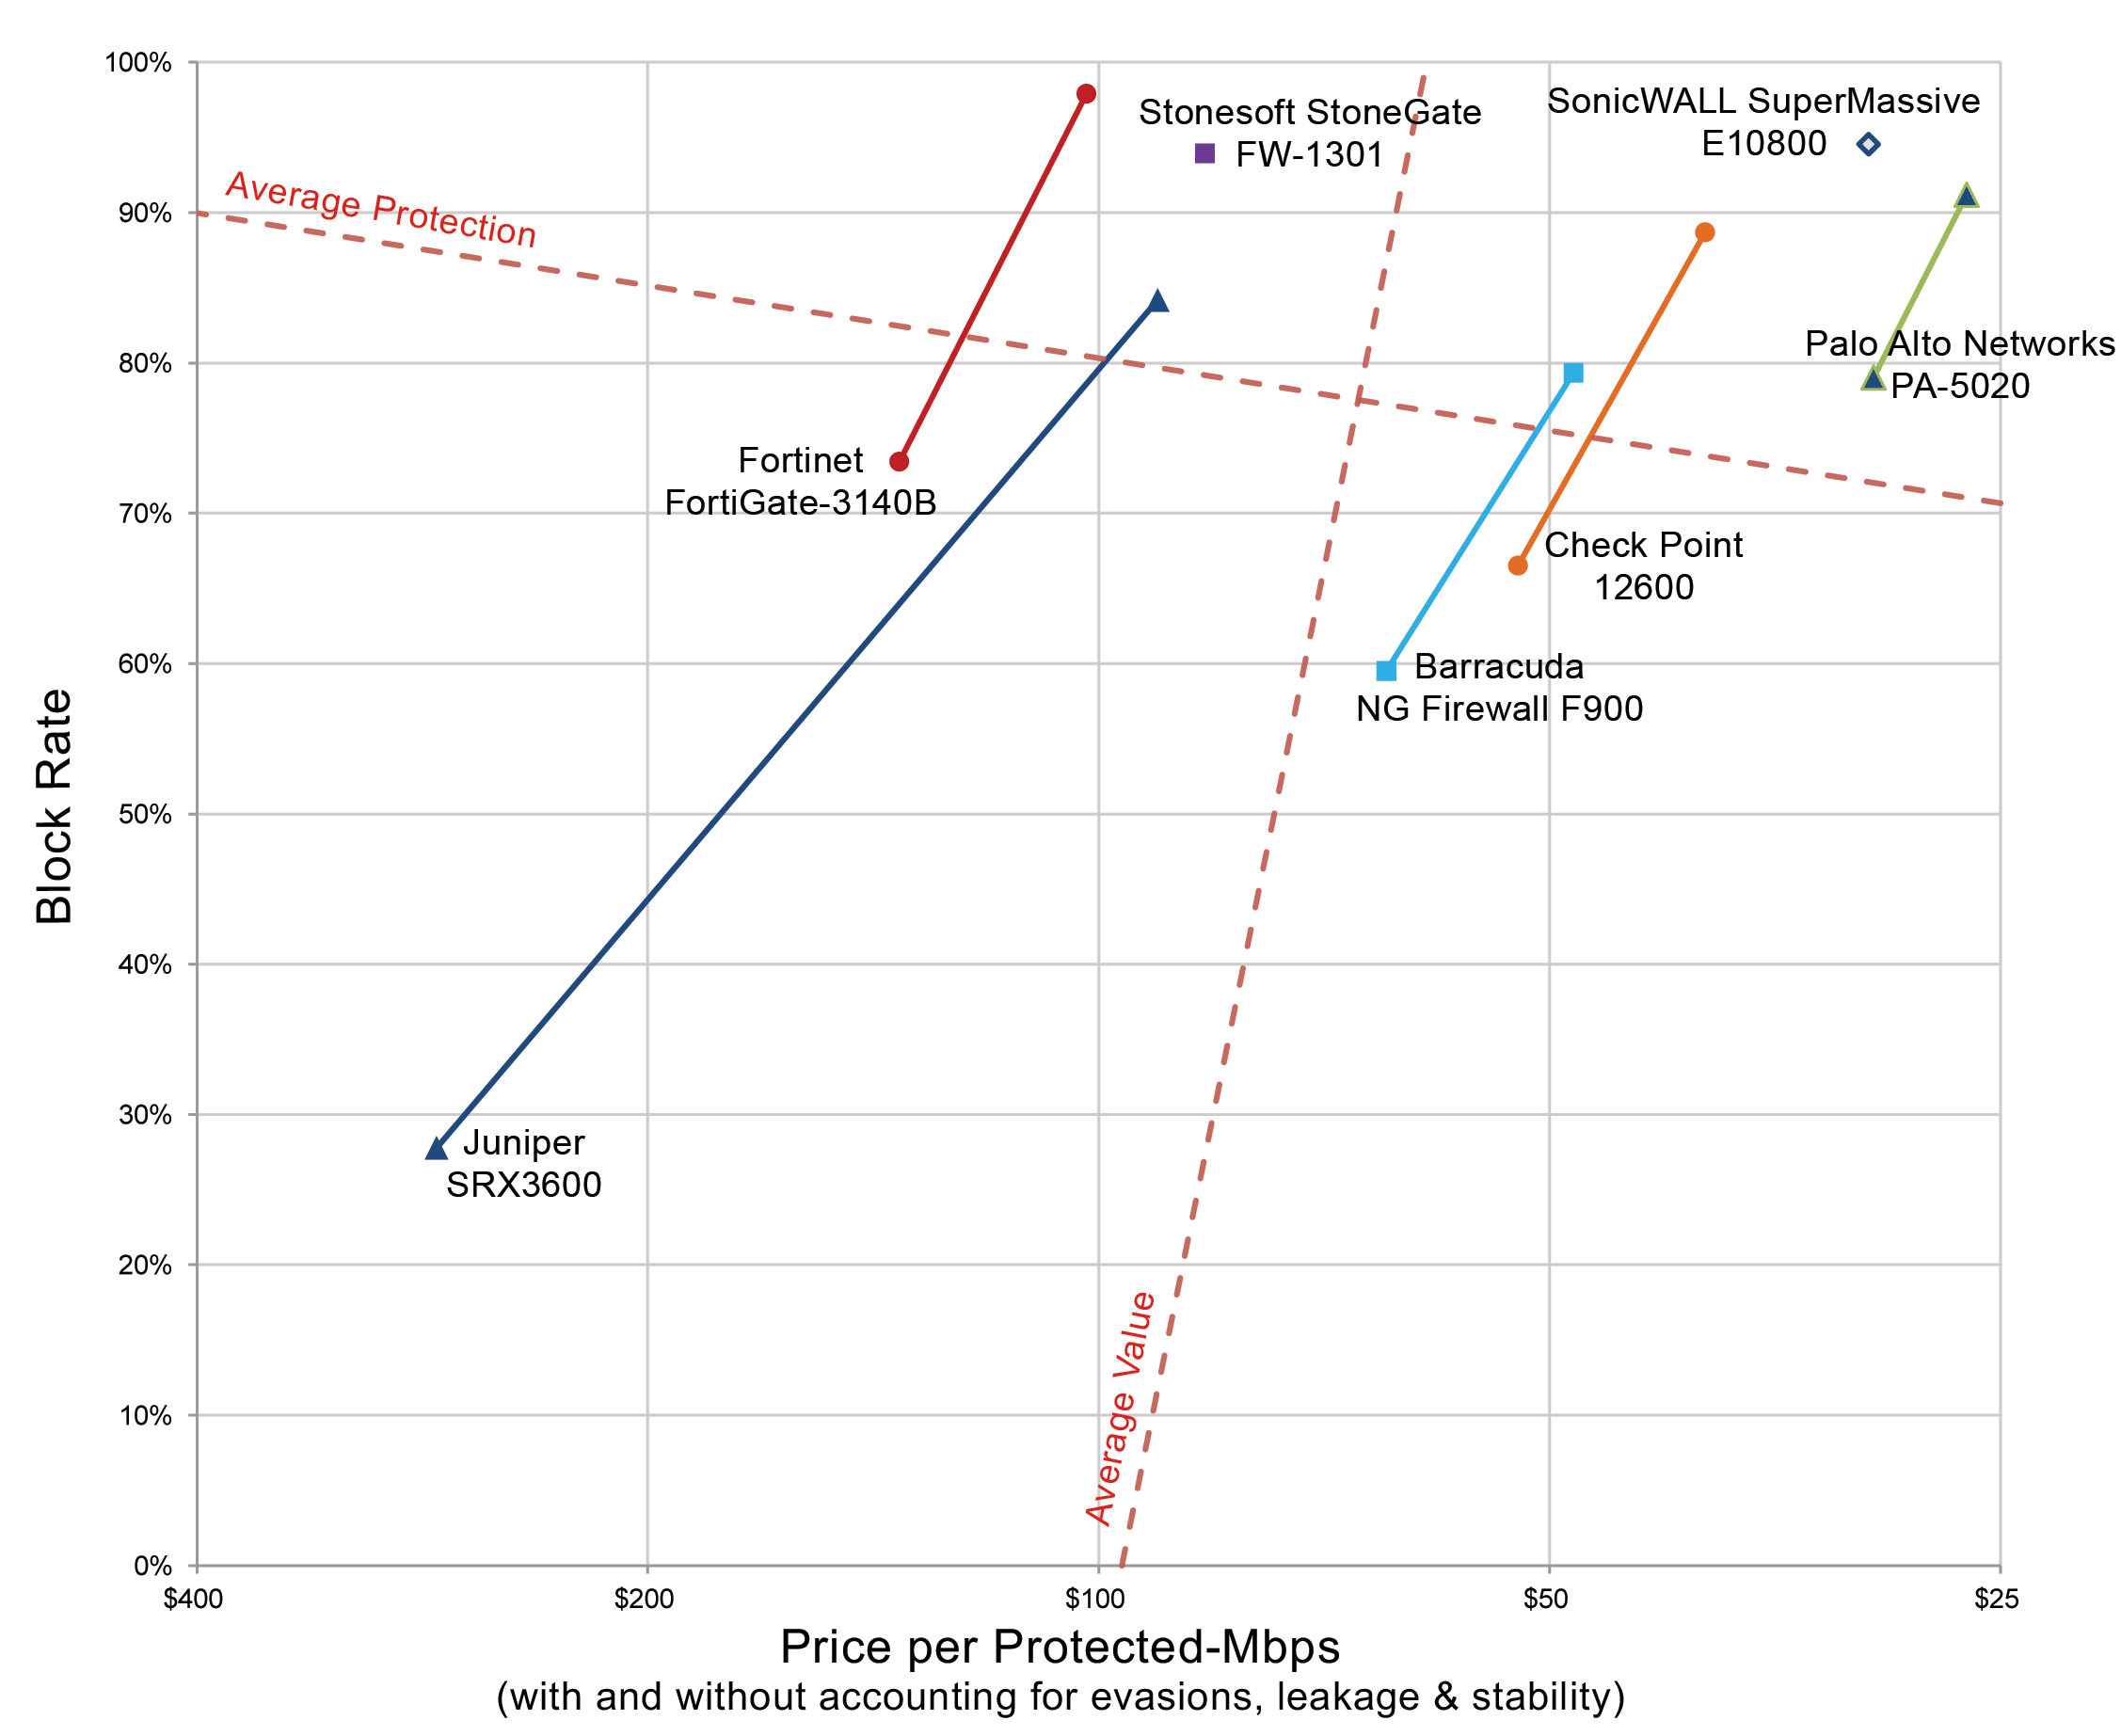
NSS Labs NGFW Security Value Map Report (2017, 2016, 2014, 2013, 2012, 2011)


It is good to compare with Gartner Magic Quadrant for Enterprise Network Firewall (2017, 2016, 2015, 2014, 2013, 2011, 2010) or Gartner Magic Quadrant for UTM (2017, 2016, 2015, 2014, 2013, 2012, 2010,...)

End users are finding that NGFWs are no longer as limiting in their performance or capability trade-offs as they once were. NSS Labs discovered that many enterprises are choosing NGFW over traditional firewalls for a variety of reasons without feeling that they are compromising on features or performance. Some NGFW solutions scale to tens of gigabits which satisfies the needs of all but the most demanding enterprise WAN connections.

NSS Labs regularly released NGFW Security Value Map™, Comparative Analysis Reports, and Product Analysis Reports.  These results help guide security professionals in the enterprise to make informed decisions when evaluating the many offerings in the industry.

NSS Labs designed the test to focus on the following four areas:
  •     Security effectiveness
  •     Performance
  •     Stability
  •     Total Cost of Ownership (TCO)
2017
June 06, 2017 (GLOBE NEWSWIRE) -- NSS Labs, Inc., the global leader in operationalizing cybersecurity, announced the results of its Next Generation Firewall (NGFW) Group Test.


Key findings include:
  • Overall Security Effectiveness ranged from 25.8% to 99.9%, with seven of the 11 tested products achieving a rating greater than 78.5%
  • TCO per Protected Mbps ranged from US$5 to US$105, with most tested products costing less than US$22 per protected Mbps.
  • The average Security Effectiveness rating was 67.3%; seven of the tested products received an above-average Security Effectiveness rating, and four of the tested products received a below-average Security Effectiveness rating.
  • The average TCO per Protected Mbps was US$25.2; eight of the tested products were rated as having above- average value, and three of the tested products were rated as having below-average value.
Tested products:
  • Barracuda NextGen Firewall F600.E20 v7.0.2
  • Check Point Software Technologies 15600 Next Generation Threat Prevention (NGTP) Appliance R77.20
  • Cisco Firepower 4110 v6.1.0.1
  • Forcepoint NGFW 3301 Appliance v6.1.2
  • Fortinet FortiGate 3200D FortiOS v5.4.4 GA Build 1117
  • Fortinet FortiGate 600D FortiOS v5.4.4 GA Build 1117
  • Juniper Networks SRX 4200 v15.1X49-D75.5
  • Palo Alto Networks PA-5250 PAN-OS 8.0.0
  • SonicWall NSA 6600 SonicOS 6.2
  • Sophos XG-750 Firewall v16.01
  • WatchGuard Firebox M4600 v11.10.7


2016

Check Point® Software Technologies Ltd. (NASDAQ: CHKP) today announced the company received its eleventh ‘Recommended’ rating from NSS Labs. Check Point’s latest results earned its fifth ‘Recommended’ rating in the NSS Labs Next Generation Firewall Test, delivering top results with the highest block rate (99.8%) from the NSS Labs Exploit Library and tied for the highest security effectiveness score (99.6%).

Hillstone Networks Next-Generation Firewall's high marks include lowest for Total Cost of Ownership (TCO) per Protected Mbps, blocking 99.6% of exploits from the NSS exploit library and blocking 98.32% of live exploits over a 2-month period from December 1, 2015 – January 31, 2016.

NSS 2016 NGFW Group Test SVM


2014

NSS Labs said the Palo Alto PA-3020 Appliance passed stability and reliability tests, and enforced firewall policies. It also correctly enforced complex outbound and inbound policies, the firm said. The appliance fell short in detecting evasion measures often used by attackers to bypass firewalls. Using RPC and IP Fragmentation attacks, NSS Labs was able to conduct a bypass. The appliance also took a performance hit, earning a 719-Mbps rating while the vendor claimed 1-Gbps performance.

NSS 2014 NGFW Group Test SVM


2013
WatchGuard's XTM 2050 appliance got poor marks and earned a caution designation after it fell well below competitors.


NSS 2013 NGFW Group Test SVM


2012

NSS 2012 NGFW Group Test SVM


2011
NSS 2011 NGFW Group Test SVM


Reference:


Friday, August 11, 2017

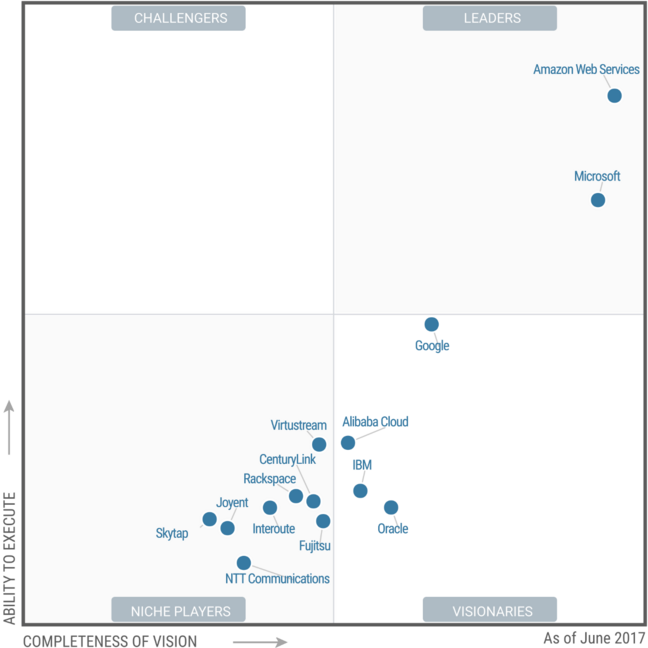
Gartner Magic Quadrant for Cloud Infrastructure as a Service (Worldwide) (2017, 2016, 2015, 2014, 2013, 2012...)

In the context of this Magic Quadrant, cloud compute IaaS (hereafter referred to simply as "cloud IaaS" or "IaaS") is defined as a standardized, highly automated offering, where compute resources, complemented by storage and networking capabilities, are owned by a service provider and offered to the customer on demand. The resources are scalable and elastic in near real time, and metered by use. Self-service interfaces are exposed directly to the customer, including a web-based UI and an API. The resources may be single-tenant or multitenant, and hosted by the service provider or on-premises in the customer's data center. Thus, this Magic Quadrant covers both public and private cloud IaaS offerings.

2017
On Jun 15 2017, Gartner has published  Magic Quadrant for Cloud Infrastructure as a Service that – no surprising  – has Amazon Web Services and Microsoft alone in the leader's quadrant, same as last few years.

Reference: Magic Quadrant for Cloud Infrastructure as a Service, Worldwide


2016

In the 2016 Magic Quadrant for Cloud Infrastructure as a Service, Worldwide, for the 6th straight year, Gartner placed Amazon Web Services in the “Leaders” quadrant and named AWS as having both the furthest completeness of vision and the highest ability to execute.
https://www.gartner.com/doc/reprints?id=1-2G2O5FC&ct=150519


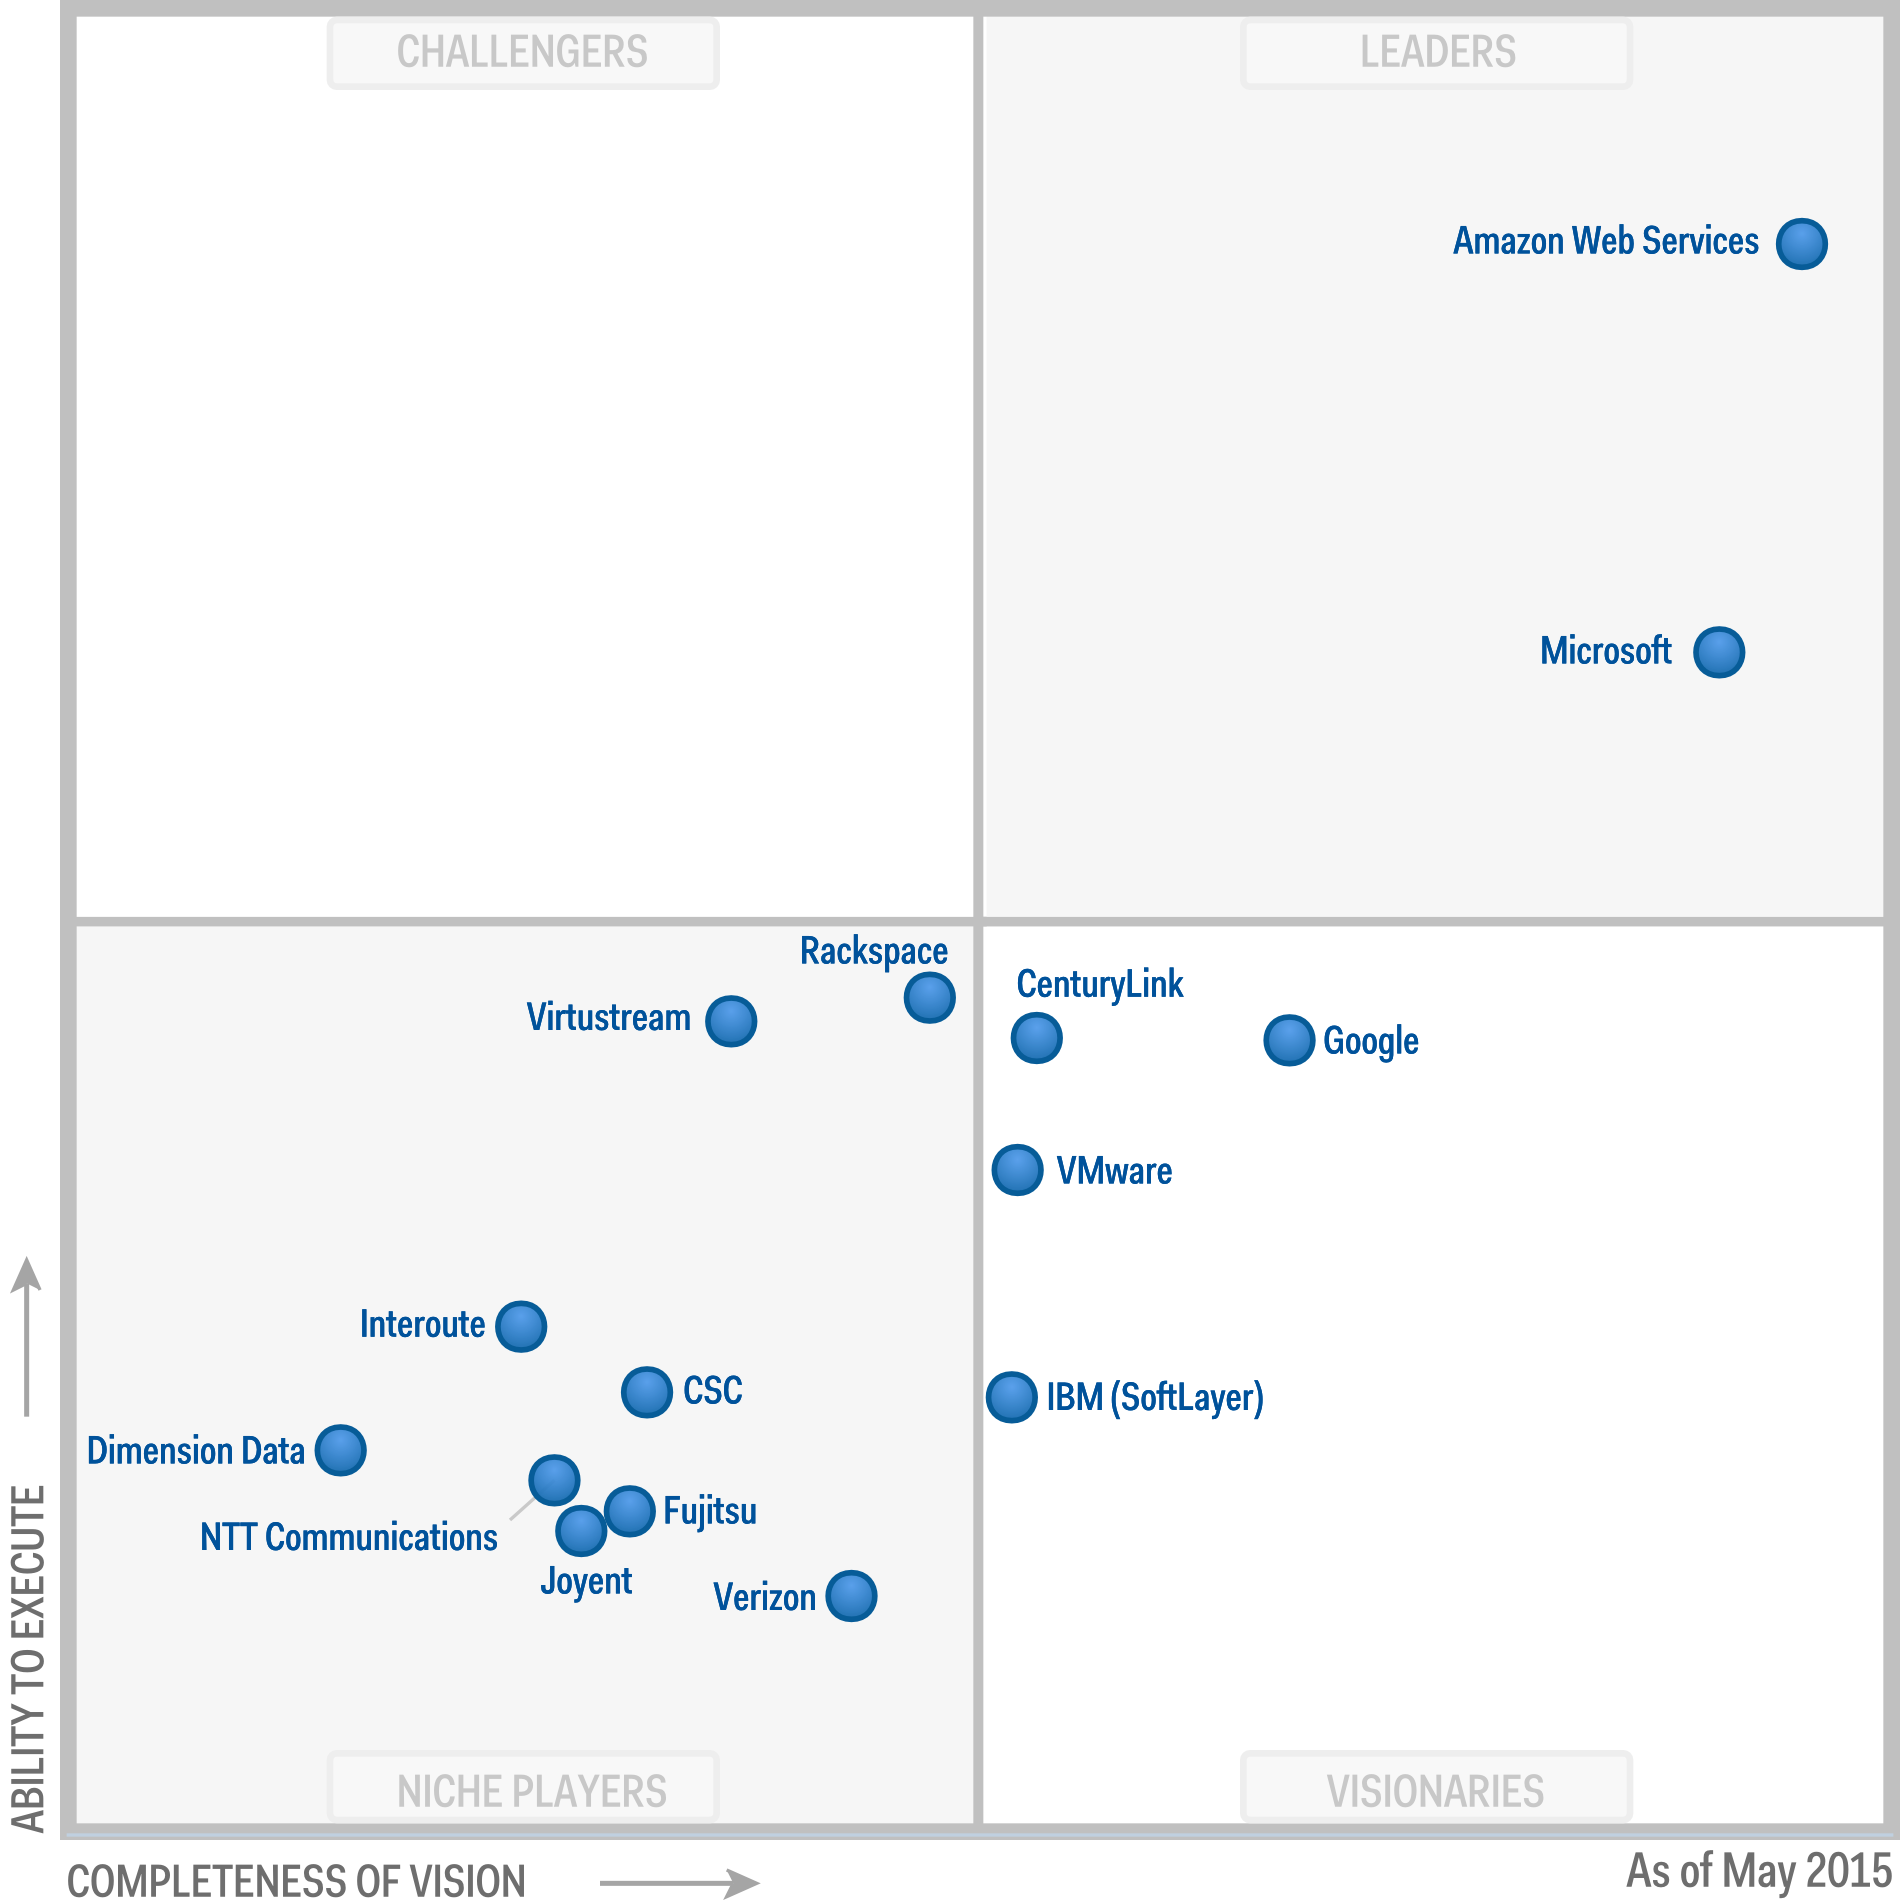
2015
In the publication "2015 Magic Quadrant for Cloud Infrastructure as a Service, Worldwide" Gartner Amazon Web Services ranks in the "Leaders" quadrant and appreciates AWS both the completeness of its vision and the most pronounced ability to implement them.


2014

According to the report, Microsoft’s Azure cloud service is already making significant inroads despite the fact that it only launched the IaaS component of its business into general availability a little over a year ago.

What’s interesting about this year’s Visionaries is that they all have new platforms — CenturyLink with the Tier 3 acquisition, CSC with the ServiceMesh acquisition coupled with the AWS partnership, Google with Google Compute Engine, IBM with the SoftLayer acquisition, and Verizon Terremark with the still-beta Verizon Cloud. (Arguably VMware falls into this bucket as well, despite being a Niche Player this year.) These providers are in the middle of reinventing themselves, most with the idea of battling it out for the #3 spot in the market.


2013


2012


2010


Thursday, July 27, 2017

Gartner Magic Quadrant for SIEM Products (2016, 2015, 2014, 2013, 2012, 2011, 2010)

Gartner defines SIEM as a technology that aggregates data produced by security devices, network infrastructure and systems, and applications. Products in the security information and event management (SIEM) market analyze security event data and network flow data in real time for internal and external threat management. They collect, store, analyze and report on log data for incident response, forensics and regulatory compliance. Vendors in this space are continually improving threat intelligence and security analytics. Companies are looking to adopt this technology in order to detect threats and breaches, and by compliance needs. Early breach discovery requires effective user activity, data access and application activity monitoring.

Companies placed by Gartner in the Leaders Quadrant have been the most successful in building an installed base and establishing a revenue stream from the SIEM market. Leaders also typically have a high share of the market and high revenue growth. They've also demonstrated superior vision and execution for emerging and anticipated requirements of the market. What's more, they've garnered positive customer feedback for their SIEM products, as well as service and support of those products. 

2016

Gartner placed five companies in the leaders quadrant: IBM, Splunk, LogRhythm, HPE, Intel Security.

Gartner Magic Quadrant for SIEM , 2017

2015


From Gartner Report "Magic Quadrant for Security Information and Event Management" Releasd on July 20, 2015.

2014


2013


2012


2011 

Magic Quadrant for Security Information and Event Management 2011

2010

Magic Quadrant for Security Information and Event Management 2010


SIEM is hot topic. SPLUNK is going to IPO started on Jan 12 2012. Also in last two years, there are a couple of milestone events happened in SIEM venders which has been listed below:

HP acquired ArcSight Sep 13, 2010, $1.5B
Solarwinds bought TriGeo Jun 23 2011, $3500
IBM acquired Q1 Labs, Oct 4 2011, $????
McAfee acquired NitroSecurity, Dec 1, 2011 $????
.
.
.


Gartner Magic Quadrant for Network Performance Monitoring and Diagnostics (2017, 2016, 2015, 2014 )

According to Gartner, Network performance monitoring and diagnostics (NPMD) enable network professionals to understand the impact of network behavior on application and infrastructure performance, and conversely, via network instrumentation. Other users and use cases exist, especially because these tools provide insight into the quality of the end-user experience.

The fast-growing network performance monitoring and diagnostics market is helping businesses support more complex environments and services through network visibility, performance issue detection and root cause analysis.

Leaders in this industry are innovating around cloud-based monitoring, better support for software-defined environments and more flexible deployment models, according to research firm Gartner. The research firm estimates that the network performance monitoring and diagnostics tool market, which is a segment of the lager network management space, sits at $1.6 billion and is growing at a compound annual growth rate of 20.7 percent.

2017
NetScout (Formerly is Fluke) , Viavi (formerly is JDSU) and Riverbed are leaders in the Gartner NPMD Magic Quadrant for the fourth consecutive year. 


2016
Viavi Solutions (Formerly is part of JDS Uniphase), Riverbed and NetScout Systems (Fluke Networks) are listed in leader Quadrant, same as 2015 and 2014.


note:Gartner Magic Quadrant 2016: Network Performance Monitoring & Diagnostics :


2015

Fluke, JDSU (Nework Instruments) and Riverbed ,  have been recognized as a "Leader" in Gartner’s 2015 “Magic Quadrant for Network Performance Monitoring and Diagnostics (NPMD)” for the second consecutive year. 


2014


Magic Quadrant for Network Performance Monitoring and Diagnostics

Source: Gartner (March 2014)